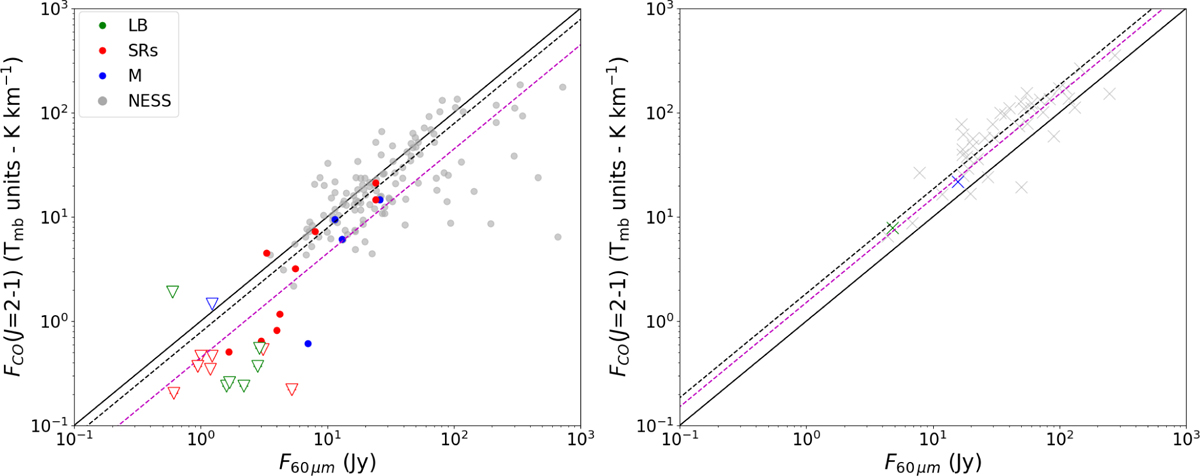
Fig. F.1
Download original image
Comparison of CO(J=2-1) with IRAS 60 μm for O-rich and C-rich AGB stars (left and right respectively). The colour and shape of the markers represent the stellar variability and chemistry type as in Fig. 4. Empty triangles are upper limits for the CO( J=2-1) intensities. Grey markers represent NESS sources. The solid black lines indicates the equality relationship between CO(J=2-1) intensity and IRAS 60 μm fluxes. The dashed lines represents linear fits to the points, solid and purple for our sample and NESS respectively.
Current usage metrics show cumulative count of Article Views (full-text article views including HTML views, PDF and ePub downloads, according to the available data) and Abstracts Views on Vision4Press platform.
Data correspond to usage on the plateform after 2015. The current usage metrics is available 48-96 hours after online publication and is updated daily on week days.
Initial download of the metrics may take a while.