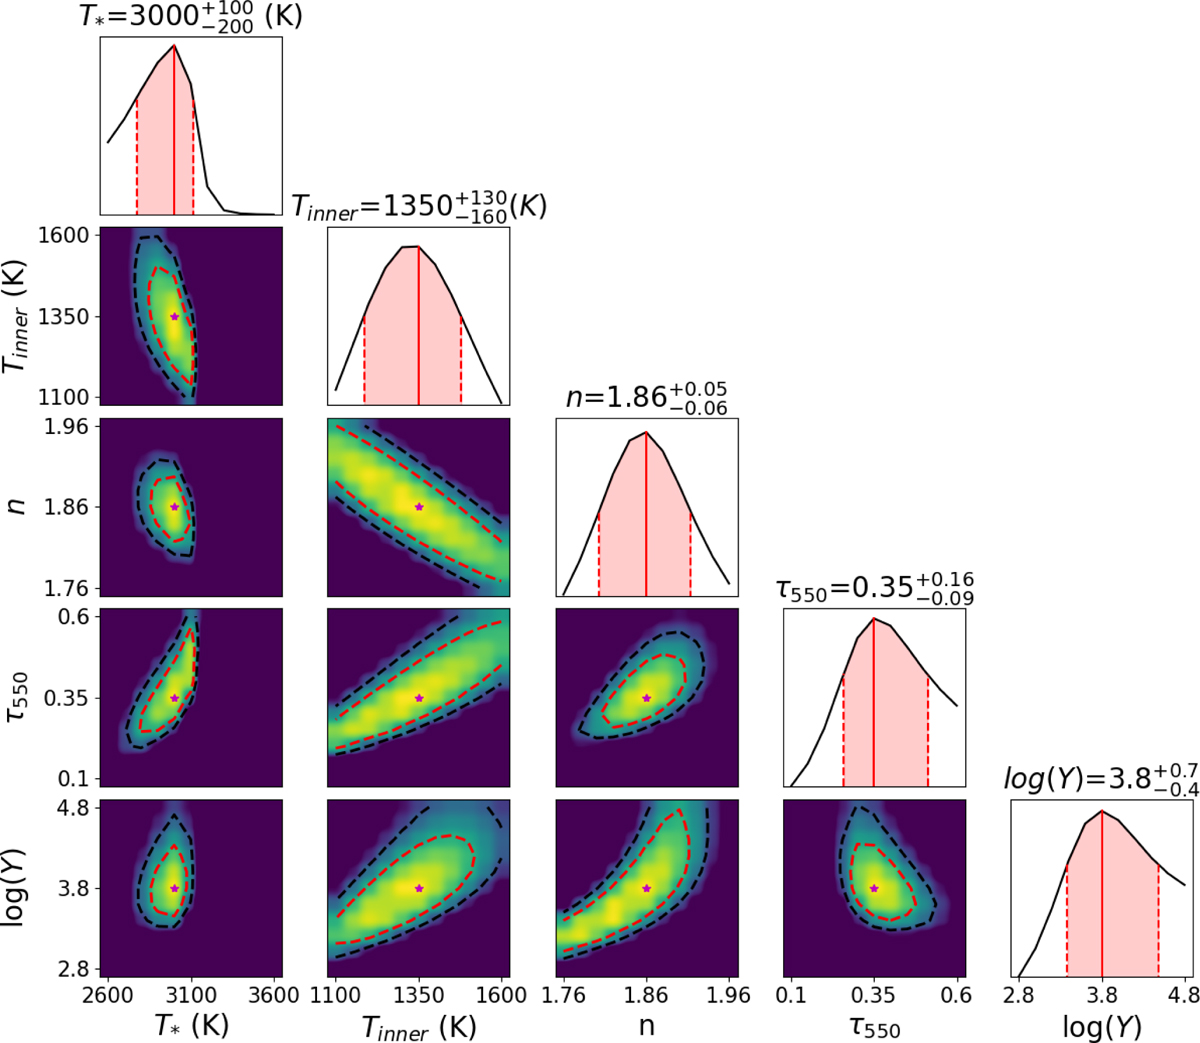
Fig. E.1
Download original image
Corner plot of EY Hya to exemplify correlations between the different free parameters. The 1D curves display the log-likelihood functions, the solid red line indicates the most likely value and the dashed red lines and shadowed region the ±1σ values. The 2D histograms display the χ2 distributions, the dashed red and black lines indicate the areas with values lower than χ2+1 and χ2+2 respectively.
Current usage metrics show cumulative count of Article Views (full-text article views including HTML views, PDF and ePub downloads, according to the available data) and Abstracts Views on Vision4Press platform.
Data correspond to usage on the plateform after 2015. The current usage metrics is available 48-96 hours after online publication and is updated daily on week days.
Initial download of the metrics may take a while.