Fig. C.3
Download original image
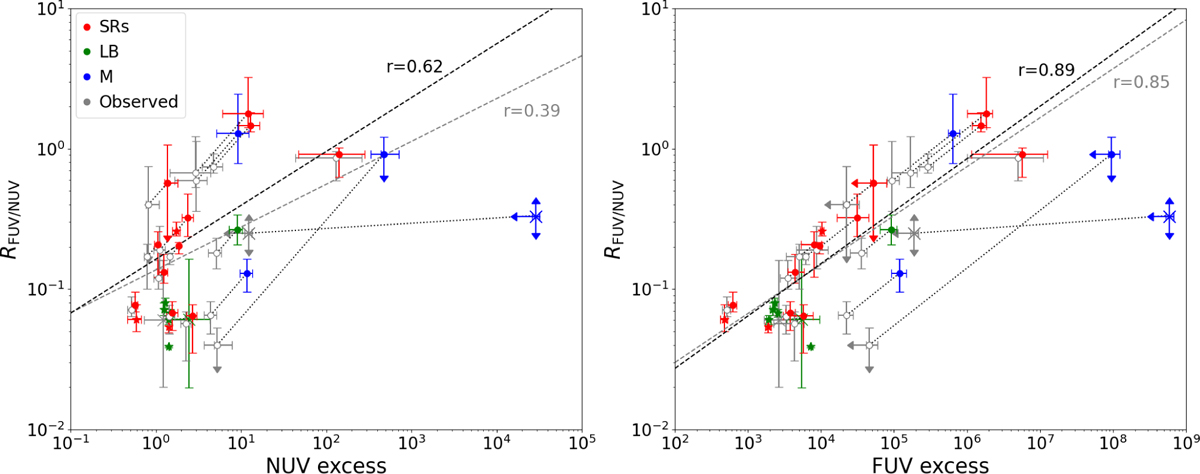
Correlations between RFUV/NUV and the NUV and FUV excesses (left and right respectively). The colour and shape of the markers represent the stellar variability and chemistry type as in Fig. 4. Grey markers are those without correction from dust attenuation. The dotted lines link the markers for the same sources before and after the dust attenuation correction. The dashed lines represents linear fits to the points.
Current usage metrics show cumulative count of Article Views (full-text article views including HTML views, PDF and ePub downloads, according to the available data) and Abstracts Views on Vision4Press platform.
Data correspond to usage on the plateform after 2015. The current usage metrics is available 48-96 hours after online publication and is updated daily on week days.
Initial download of the metrics may take a while.