Fig. B.2
Download original image
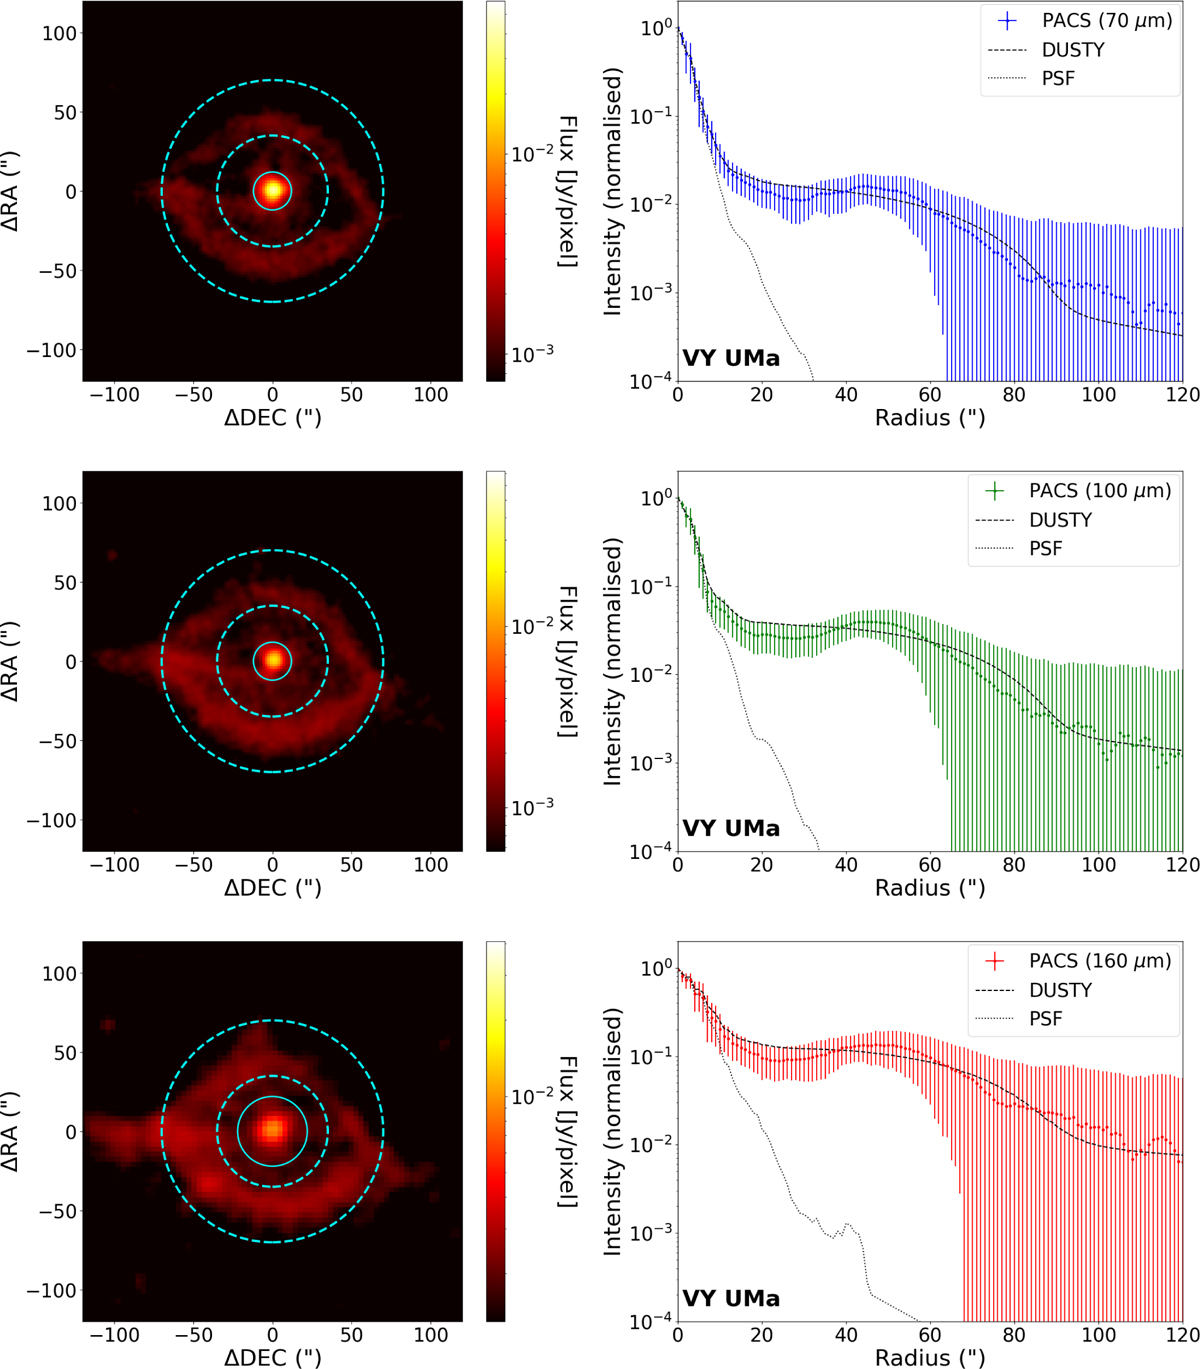
Left : Herschel/PACS images of VYUMa. The solid cyan represents the aperture used to isolate the central component (representing the present-day mass-loss), and the dashed cyan lines the aperture used to measure the extended detached shell. Right : Radial surface brightness profiles, the markers indicate the surface brightness from the images, the dashed line the surface brightness from DUSTY models convolved with their respective Herschel/PACS PSFs, and the dotted lines the Herschel/PACS PSFs.
Current usage metrics show cumulative count of Article Views (full-text article views including HTML views, PDF and ePub downloads, according to the available data) and Abstracts Views on Vision4Press platform.
Data correspond to usage on the plateform after 2015. The current usage metrics is available 48-96 hours after online publication and is updated daily on week days.
Initial download of the metrics may take a while.