Fig. 1
Download original image
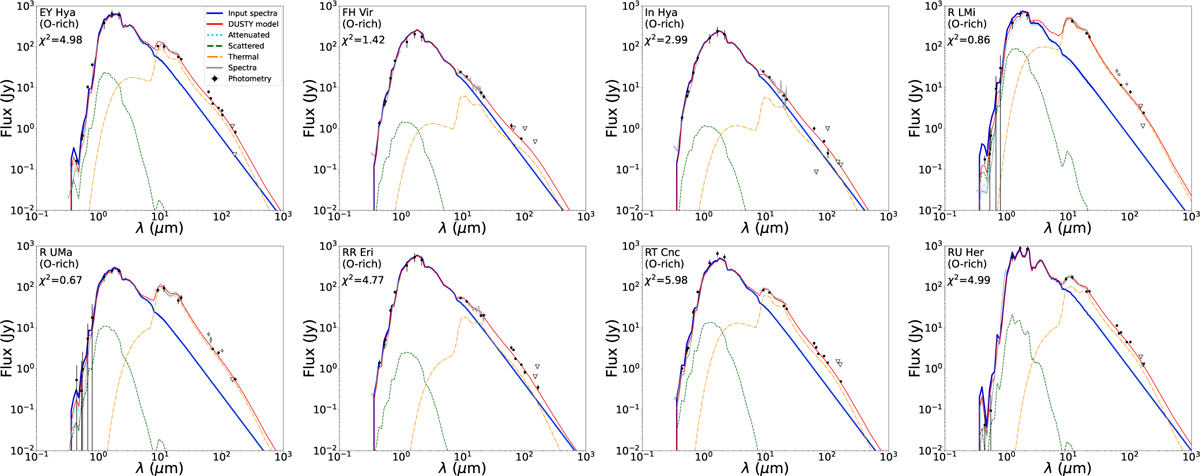
SEDs and best-fit DUSTY models for the dusty AGB stars. Solid blue line: input spectra; solid red line: total DUSTY model; dotted cyan line: attenuated input spectral component; dashed green line: dust scattered component; dot-dashed orange line: dust thermal component. Photometric fluxes are indicated as filled circles (in a few cases the variability-induced uncertainties are larger than the average value), photometric data not included in the analysis as empty circles, and upper limits as empty triangles. Solid grey lines are GAIA, IRAS, and ISO spectra; shadowed areas indicate 10% uncertainties.
Current usage metrics show cumulative count of Article Views (full-text article views including HTML views, PDF and ePub downloads, according to the available data) and Abstracts Views on Vision4Press platform.
Data correspond to usage on the plateform after 2015. The current usage metrics is available 48-96 hours after online publication and is updated daily on week days.
Initial download of the metrics may take a while.