Fig. E.1
Download original image
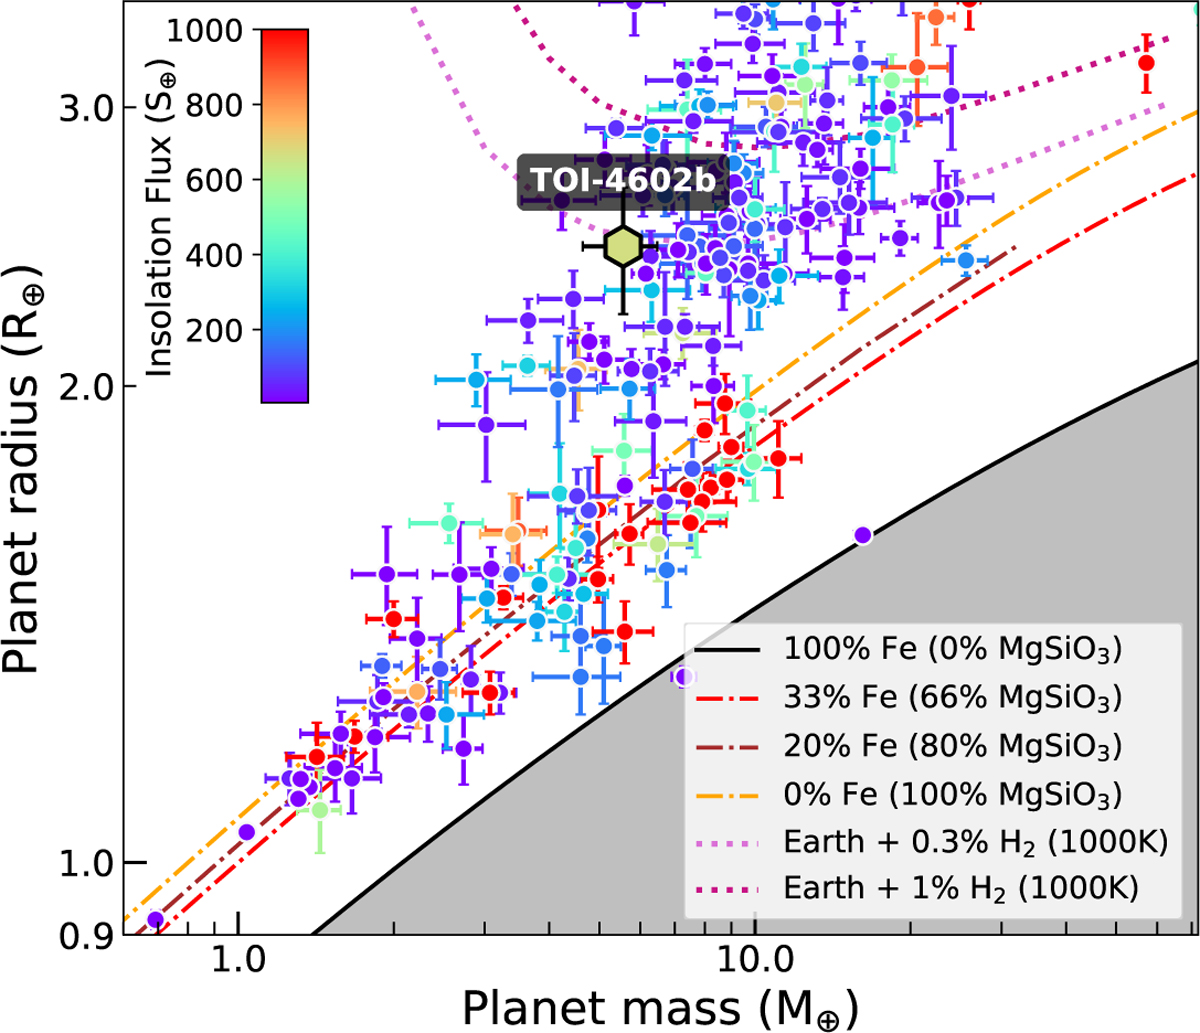
Mass-radius diagram of exoplanets with mass and radius derived with precision better than 20% and 10%, respectively. The colour indicates the stellar insolation in Earth units (see colour bar in the upper left corner). The mass and radius of TOI-4602 b, as derived in this work, are highlighted on the diagram. Theoretical mass-radius curves, computed assuming a surface temperature of 1000 K, are over-plotted for reference. The curve corresponding to a 20% Fe core mass fraction is taken from Zeng et al. (2016), while the remaining composition models are from Zeng et al. (2019). From top to bottom, the curves correspond to: Earth-like rocky cores (32.5% Fe + 67.5% MgSiO3) with a 0.3% and 1% H2 envelopes, and rocky compositions with varying silicates fractions (100% Fe, 33% Fe + 66% MgSiO3, 20% Fe + 80% MgSiO3, 100% MgSiO3). This plot has been generated with mr-plotter (Castro-González et al. 2023, https://github.com/castro-gzlz/mr-plotter/).
Current usage metrics show cumulative count of Article Views (full-text article views including HTML views, PDF and ePub downloads, according to the available data) and Abstracts Views on Vision4Press platform.
Data correspond to usage on the plateform after 2015. The current usage metrics is available 48-96 hours after online publication and is updated daily on week days.
Initial download of the metrics may take a while.