Fig. D.1
Download original image
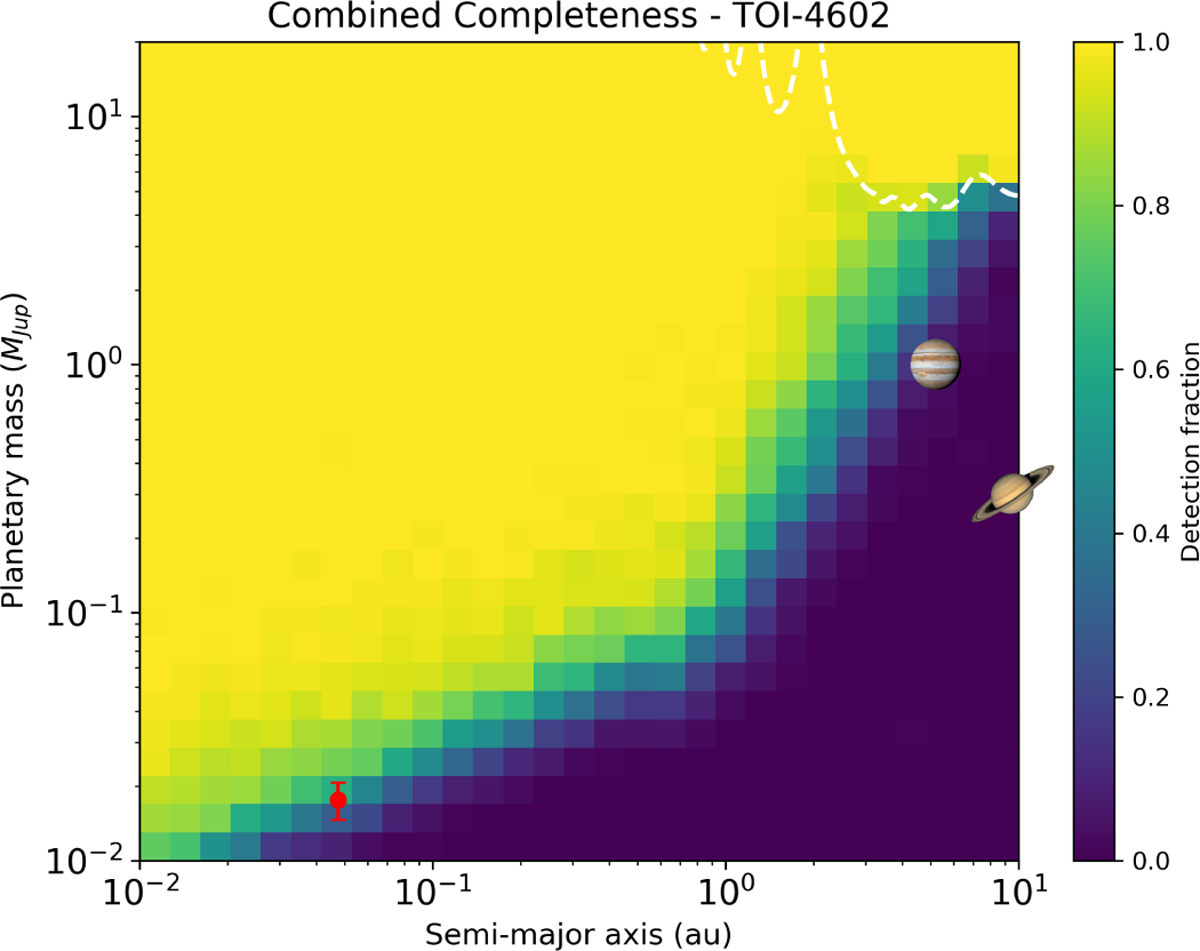
Detection completeness map for TOI-4602 in the mass versus semi-major axis plane, combining RV and PMa constraints. The colour scale represents the detection fraction of simulated planetary companions. The white dashed line indicates the astrometric detection limit, corresponding to a PMa signal of 3σ based on the Hipparcos-Gaia eDR3 baseline. Regions above this line are accessible via astrometry, while the inner regions are probed by RVs. The red circle marks the positions of TOI-4602 b. For context, Jupiter and Saturn are shown as icons.
Current usage metrics show cumulative count of Article Views (full-text article views including HTML views, PDF and ePub downloads, according to the available data) and Abstracts Views on Vision4Press platform.
Data correspond to usage on the plateform after 2015. The current usage metrics is available 48-96 hours after online publication and is updated daily on week days.
Initial download of the metrics may take a while.