Fig. 4
Download original image
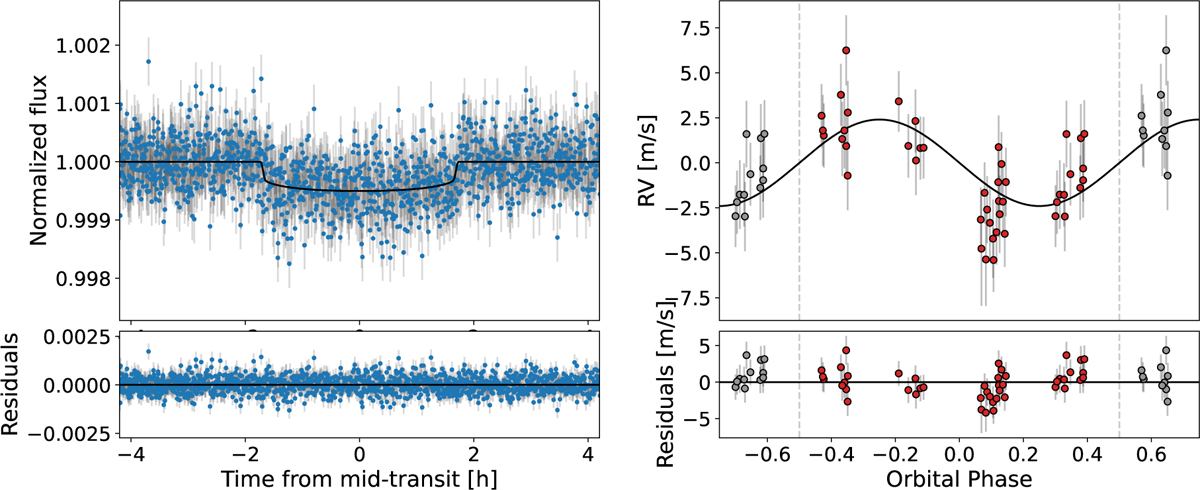
Modelling of photometric and spectroscopic time series obtained from the joint fit assuming a circular model. (Left) Photometric modelling of the TOI-4602 b planetary signal. The top panel displays the normalized, phase-folded TESS transits overlaid with the best-fit model (black line), while the bottom panel shows the residuals between the observed data and the model. (Right) Phase-folded RV fit of TOI-4602 b planetary signal. The reported error bars include the jitter term, added in quadrature. The bottom panel displays the residuals of the fit.
Current usage metrics show cumulative count of Article Views (full-text article views including HTML views, PDF and ePub downloads, according to the available data) and Abstracts Views on Vision4Press platform.
Data correspond to usage on the plateform after 2015. The current usage metrics is available 48-96 hours after online publication and is updated daily on week days.
Initial download of the metrics may take a while.