Fig. 3
Download original image
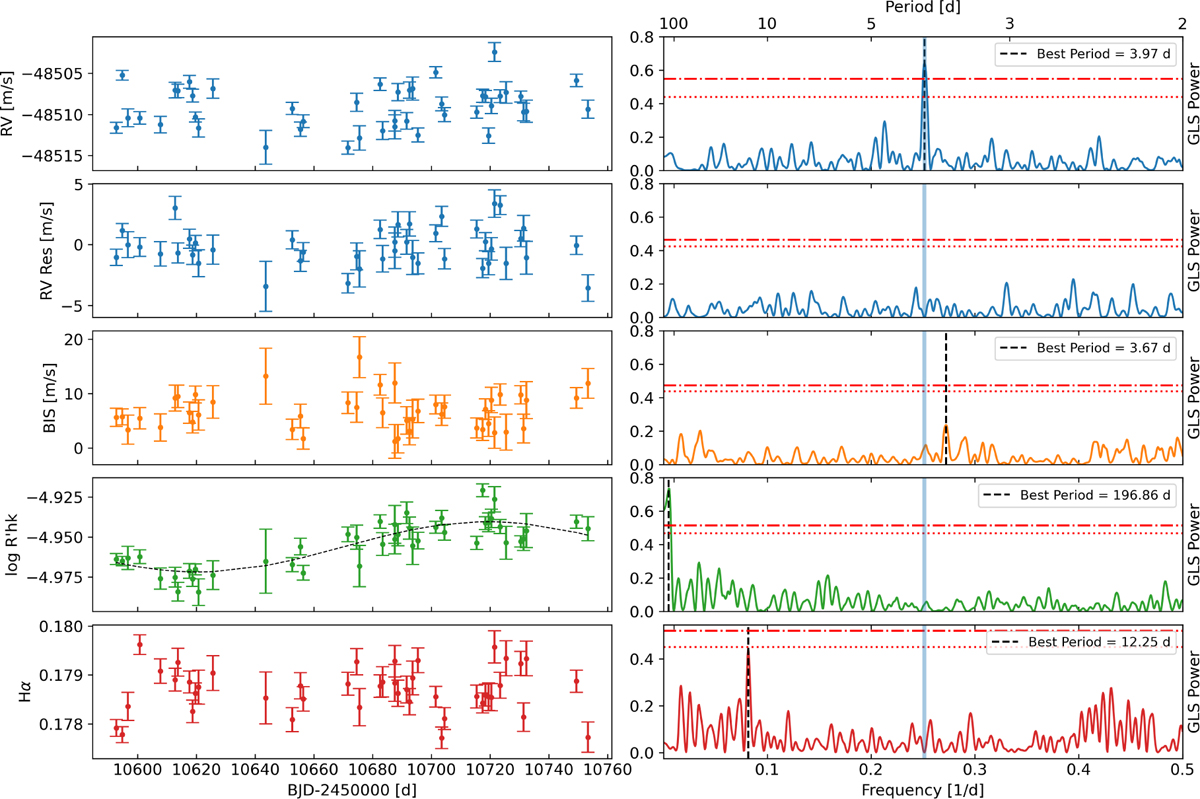
Spectroscopic time series and GLS periodogram. Left: HARPS-N spectroscopic time series analysed in this work. From top to bottom, the panels show the RVs, RV residuals, BIS, log ![]() , and Hα measurements. In the log
, and Hα measurements. In the log ![]() panel, a sinusoidal modulation – plotted as a black dashed line – is visible, suggesting the presence of a stellar activity cycle, consistent with the period identified in the corresponding GLS periodogram. Right: GLS periodograms of the RVs and the spectroscopic activity indicators. The primary peak in each periodogram is marked with a vertical black dashed line. The vertical blue shaded area highlights the period signal at 3.981 days, consistent with the transit-like periodicity identified in the TLS analysis. The horizontal dash-dotted and dotted lines mark, respectively, the 0.1% and the 1% FAP levels as evaluated using the bootstrap method.
panel, a sinusoidal modulation – plotted as a black dashed line – is visible, suggesting the presence of a stellar activity cycle, consistent with the period identified in the corresponding GLS periodogram. Right: GLS periodograms of the RVs and the spectroscopic activity indicators. The primary peak in each periodogram is marked with a vertical black dashed line. The vertical blue shaded area highlights the period signal at 3.981 days, consistent with the transit-like periodicity identified in the TLS analysis. The horizontal dash-dotted and dotted lines mark, respectively, the 0.1% and the 1% FAP levels as evaluated using the bootstrap method.
Current usage metrics show cumulative count of Article Views (full-text article views including HTML views, PDF and ePub downloads, according to the available data) and Abstracts Views on Vision4Press platform.
Data correspond to usage on the plateform after 2015. The current usage metrics is available 48-96 hours after online publication and is updated daily on week days.
Initial download of the metrics may take a while.