Fig. 2
Download original image
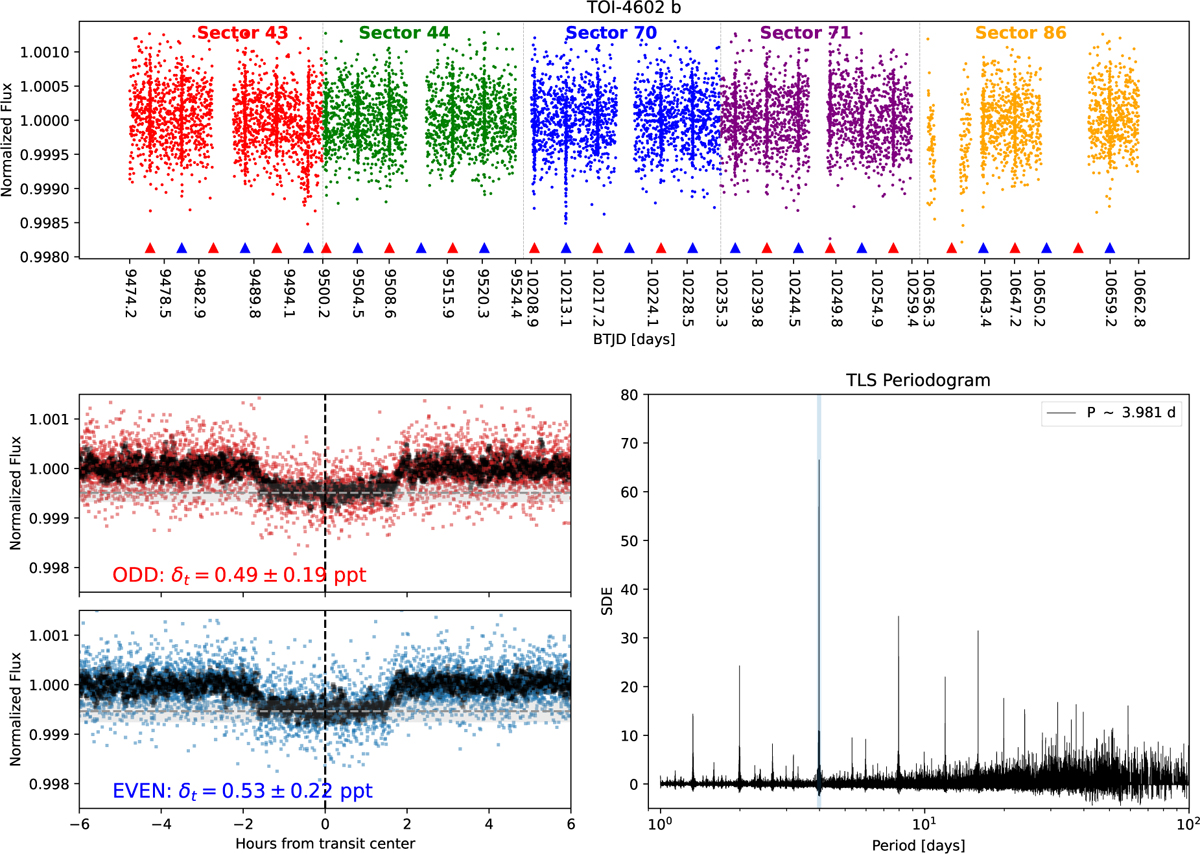
(Top panel) Normalized TESS PDCSAP light curves from all available sectors. The out-of-transit data have been binned to 20 minutes to improve the signal-to-noise ratio, while the in-transit data are kept at the original cadence to preserve the transit shape. Red and blue triangles mark the positions of odd and even transits, respectively. BTJD refers to the Baycentric TESS Julian Date, which is the time stamp measured in BJD and offset by 2 450 000.0. Dots in different colours represent different TESS sectors, with vertical dashed lines indicating the boundaries between them. (Bottom left panels) Odd and even transits folded using a period of 3.98 days. The consistent transit depths between odd and even transits show no evidence of alternating primary and secondary eclipses, disfavouring an eclipsing binary scenario at twice the orbital period. Black curves show smoothed light curves obtained via a moving average. (Bottom right panel) TLS periodogram of TOI 4602 b light curves. The highest peak corresponds to the main transit signal at P ≈3.98 days. The additional secondary peaks visible in the periodogram correspond to harmonics (e.g. P/2, 2P) and aliases of this primary periodicity.
Current usage metrics show cumulative count of Article Views (full-text article views including HTML views, PDF and ePub downloads, according to the available data) and Abstracts Views on Vision4Press platform.
Data correspond to usage on the plateform after 2015. The current usage metrics is available 48-96 hours after online publication and is updated daily on week days.
Initial download of the metrics may take a while.