Fig. G.1
Download original image
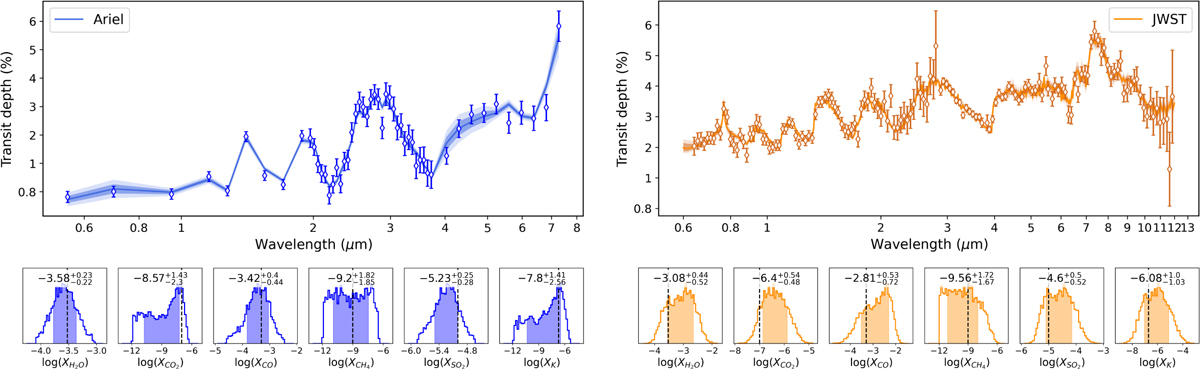
Simulated spectra of TOI-4602 b as observed by Ariel (left panels) and JWST (right panels). Bottom panels show the posterior distribution of the VMRs of the molecules for each simulation, respectively. The shaded areas represent the 1σ uncertainty, while the values report the media and 1σ span of the posteriors. Black dashed lines highlight the VMRs of the input model.
Current usage metrics show cumulative count of Article Views (full-text article views including HTML views, PDF and ePub downloads, according to the available data) and Abstracts Views on Vision4Press platform.
Data correspond to usage on the plateform after 2015. The current usage metrics is available 48-96 hours after online publication and is updated daily on week days.
Initial download of the metrics may take a while.