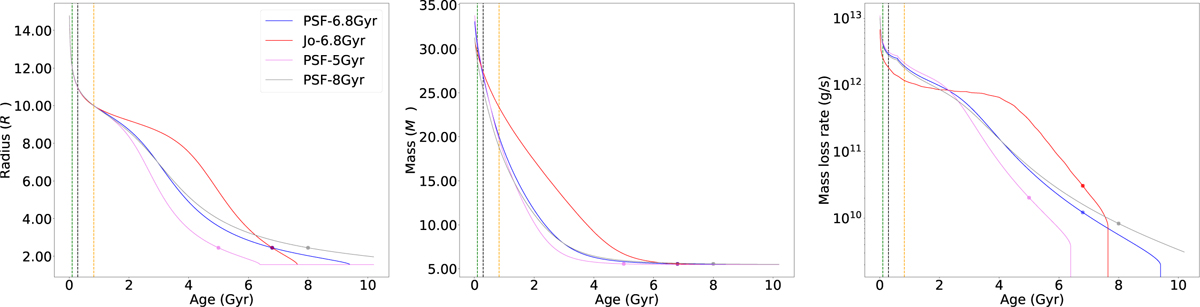
Fig. F.1
Download original image
Temporal evolution of planetary parameters of TOI-4602 b. The left, middle and right panels show the evolution of radius, mass, and mass-loss rate, respectively. The colours refers to different high-energy evolutionary tracks as described in the text. The coloured circles indicate the planet’s current position, which depends on the age assumed in the model. In the left and middle panels, the red and blue circles coincide. Vertical dashed lines mark the limit of validity for analytical models, beyond which data are extrapolated to 10 Myr. These include the Lopez & Fortney (2014) envelope radius equation (orange), the mass loss rate ATES expression (black), and the Penz et al. (2008) X-ray luminosity equation (green) (Johnstone et al. 2021 track is valid beyond these thresholds).
Current usage metrics show cumulative count of Article Views (full-text article views including HTML views, PDF and ePub downloads, according to the available data) and Abstracts Views on Vision4Press platform.
Data correspond to usage on the plateform after 2015. The current usage metrics is available 48-96 hours after online publication and is updated daily on week days.
Initial download of the metrics may take a while.