Fig. 3.
Download original image
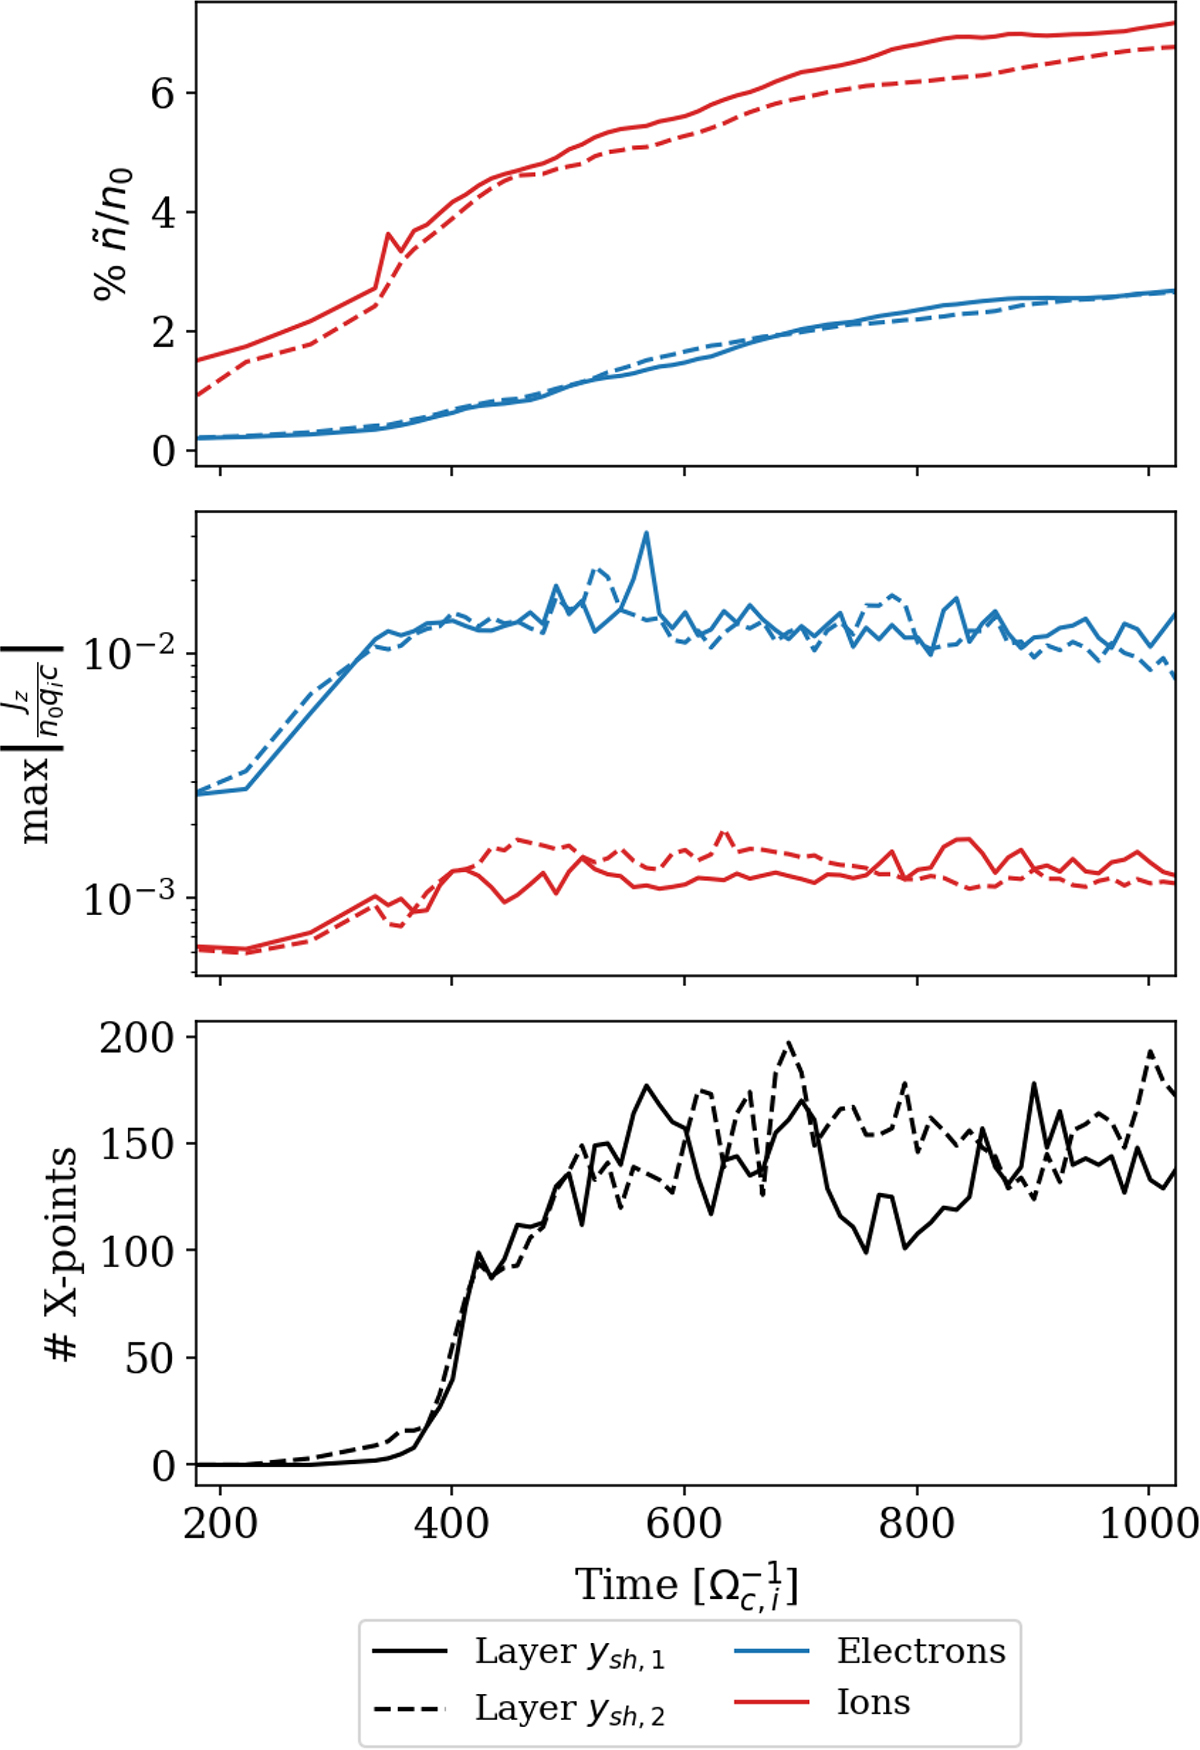
Temporal evolution of plasma mixing, current density, and X-points. The bottom and top shear layers (ysh, 1, solid; ysh, 2, dashed) are indicated in all panels. Top panel: percentage of mixed plasma, ![]() , for electrons (blue) and ions (red). Middle panel: maximum absolute out-of-plane current density, |Jz/(n0qic)|, for electrons (blue) and ions (red). Bottom panel: number of X-points in each shear layer.
, for electrons (blue) and ions (red). Middle panel: maximum absolute out-of-plane current density, |Jz/(n0qic)|, for electrons (blue) and ions (red). Bottom panel: number of X-points in each shear layer.
Current usage metrics show cumulative count of Article Views (full-text article views including HTML views, PDF and ePub downloads, according to the available data) and Abstracts Views on Vision4Press platform.
Data correspond to usage on the plateform after 2015. The current usage metrics is available 48-96 hours after online publication and is updated daily on week days.
Initial download of the metrics may take a while.