Fig. 2.
Download original image
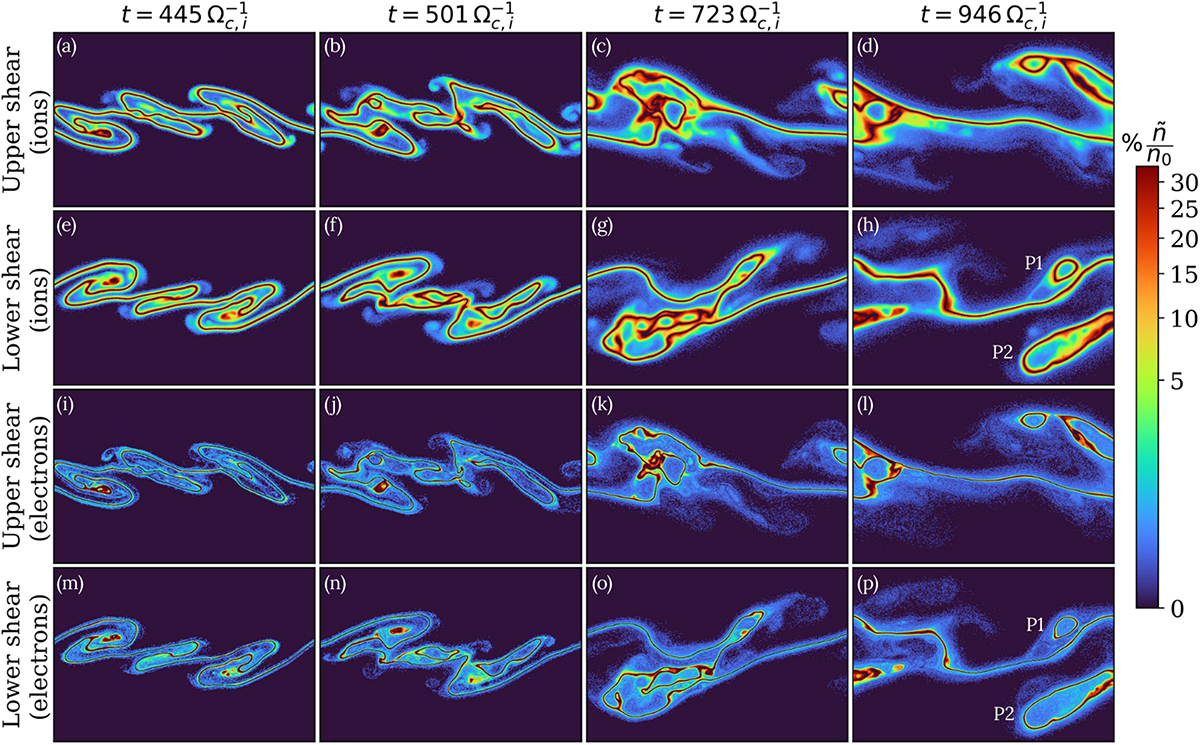
Morphological evolution of the lower (y = ysh, 1) and upper (y = ysh, 2) shear layers at t = 445, 501, 723, and ![]() during the nonlinear stage of the KHI. Each panel shows a region around each shear that is 100 × 150 di2. The color bar shows
during the nonlinear stage of the KHI. Each panel shows a region around each shear that is 100 × 150 di2. The color bar shows ![]() in percentages, which describes the mixing of the two plasma regions normalized to the initial value (see text). The top two rows show the ion mixing (a–d upper shear, e–h lower shear), and the bottom two rows show the electron mixing (i–l upper shear, m–p lower shear).
in percentages, which describes the mixing of the two plasma regions normalized to the initial value (see text). The top two rows show the ion mixing (a–d upper shear, e–h lower shear), and the bottom two rows show the electron mixing (i–l upper shear, m–p lower shear).
Current usage metrics show cumulative count of Article Views (full-text article views including HTML views, PDF and ePub downloads, according to the available data) and Abstracts Views on Vision4Press platform.
Data correspond to usage on the plateform after 2015. The current usage metrics is available 48-96 hours after online publication and is updated daily on week days.
Initial download of the metrics may take a while.