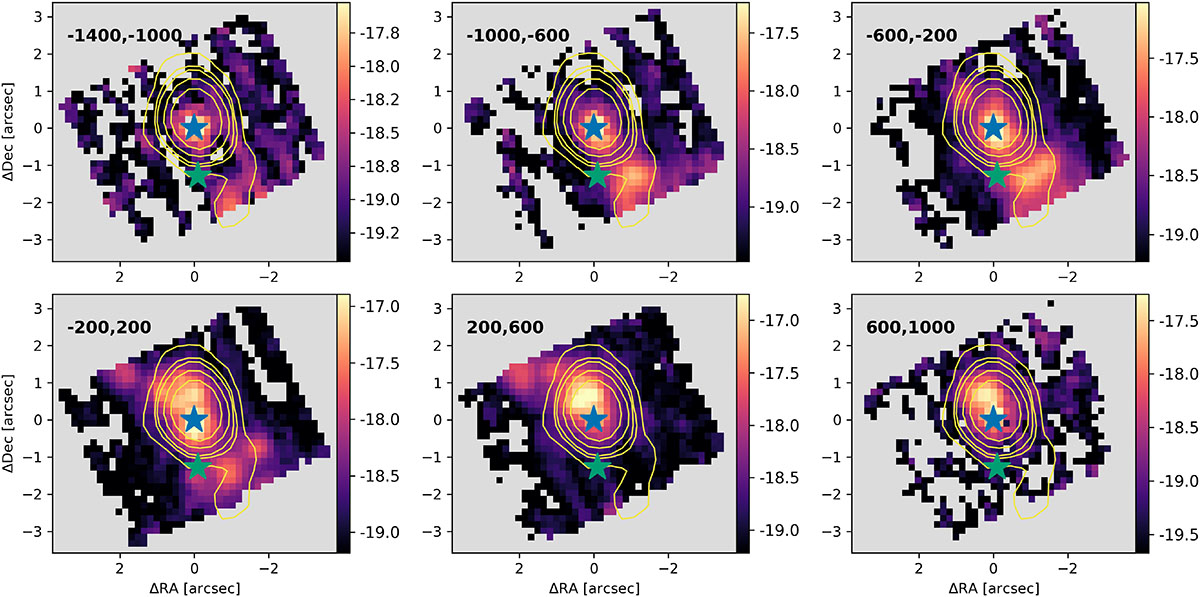
Fig. A.4.
Download original image
[Ne VI]7.6μm velocity channel maps from -1400 to 1000 km s−1 in increments of 400 km s−1. The velocity slice used to produce each channel map is indicated on the top left corner of each panel. The zero velocity corresponds to the central wavelength of [Ne V], redshifted to z = 0.1232. The local continuum in each spaxel, modeled by a first degree polynomial, is subtracted from the line flux before building the velocity channels. The color bar is in logarithmic scale in units of erg s−1 cm−2 pix−1. The VLA 6 GHz contours from Jarvis et al. (2019) are overlaid, at levels of (3, 10, 15, 30, 60)×σ. The stars mark the location of J1356N and J1356S measured from the HST F160W image (see Fig. 1).
Current usage metrics show cumulative count of Article Views (full-text article views including HTML views, PDF and ePub downloads, according to the available data) and Abstracts Views on Vision4Press platform.
Data correspond to usage on the plateform after 2015. The current usage metrics is available 48-96 hours after online publication and is updated daily on week days.
Initial download of the metrics may take a while.