Fig. A.2.
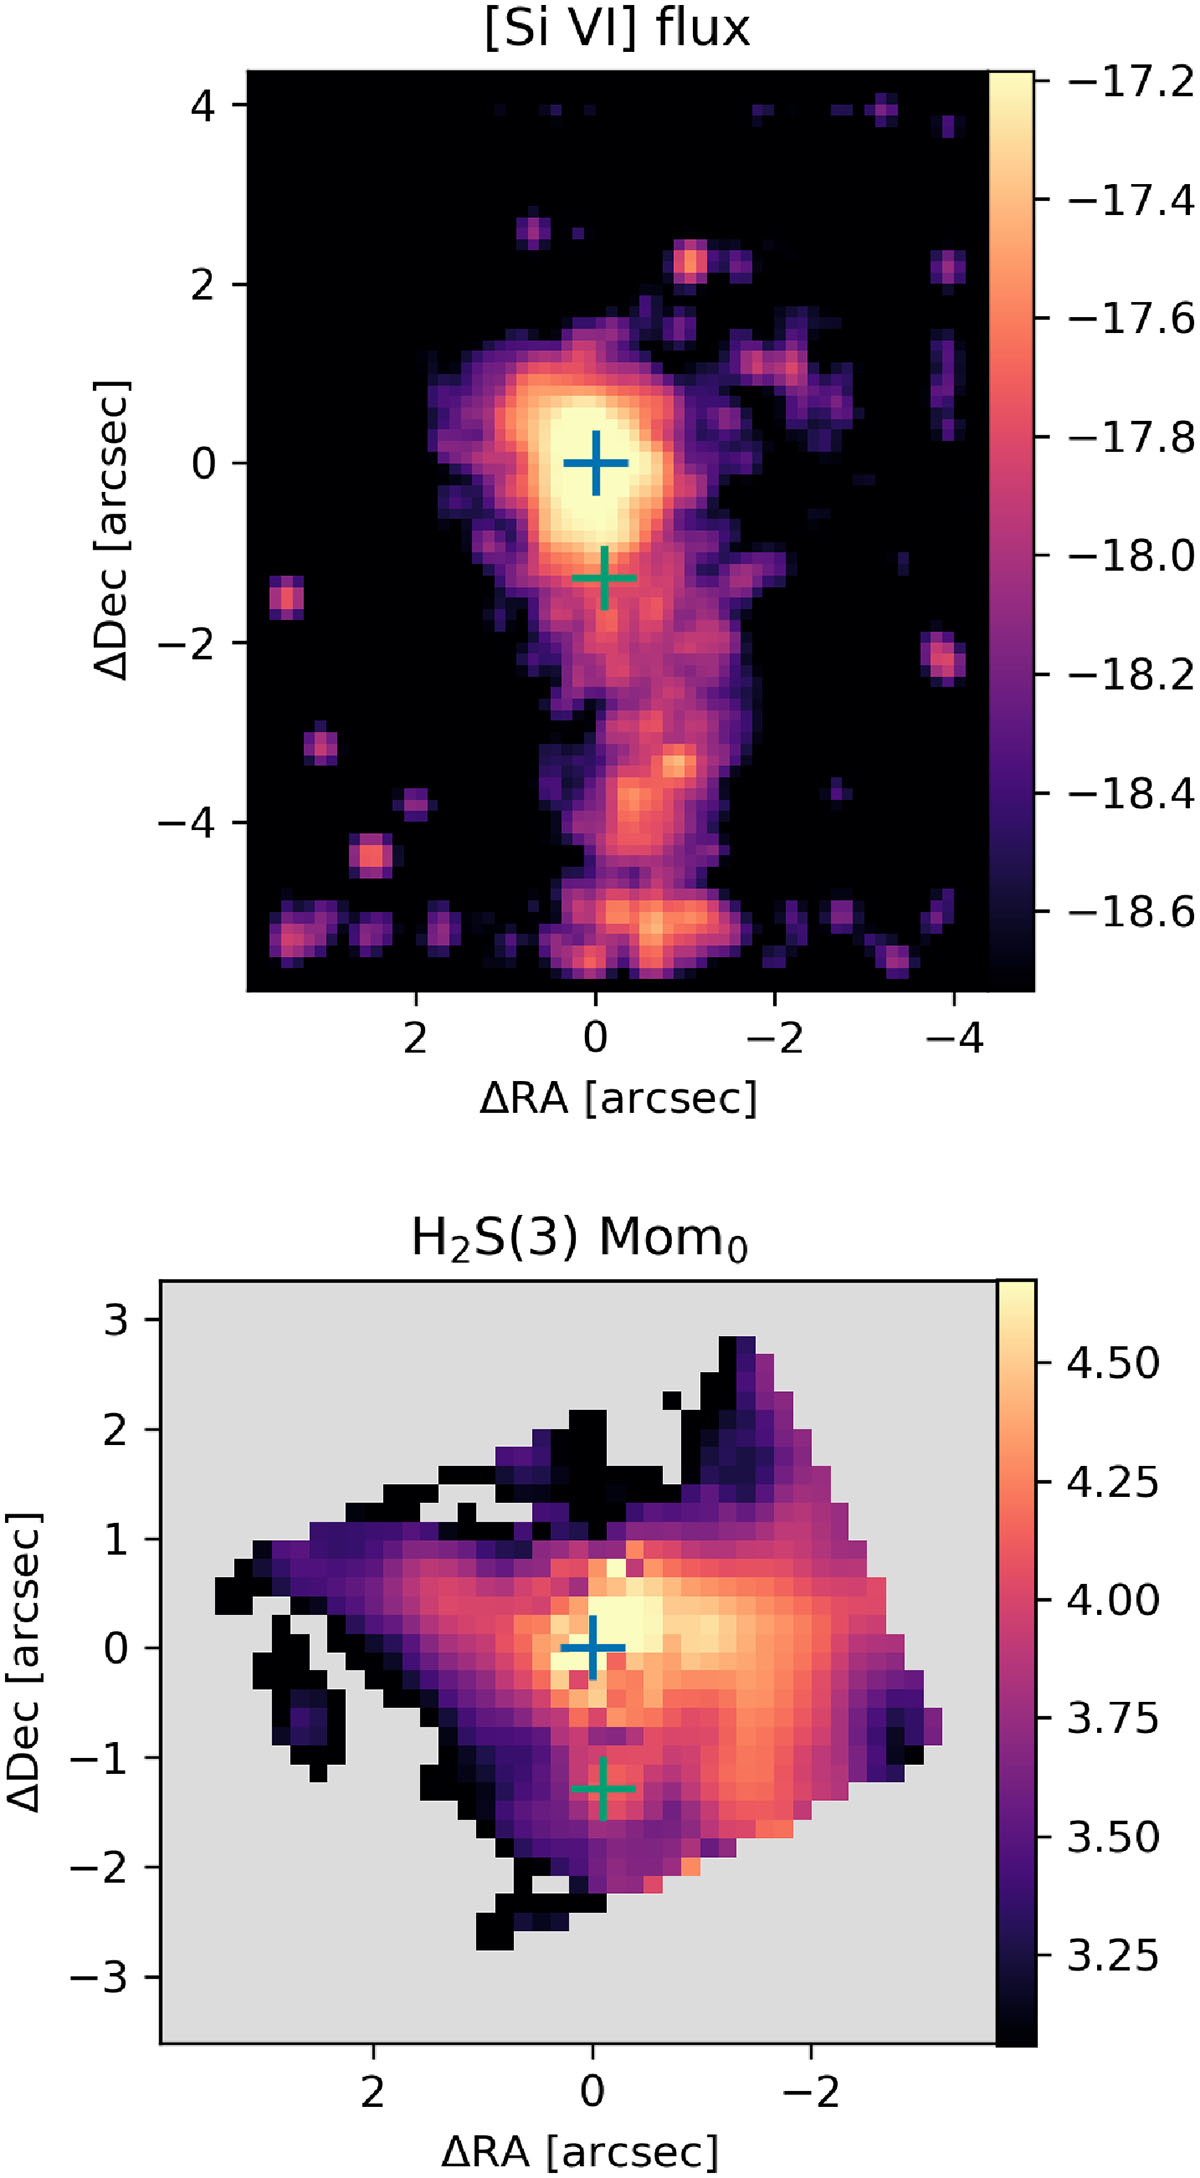
Download original image
The top panel shows the VLT/SINFONI continuum-subtracted [Si VI]1.963 μm flux map obtained from the fitting of one Gaussian component to the emission line. The color bar is in units of erg s−1 cm−2. The bottom panel shows the JWST/MIRI PSF- and continuum-subtracted H20 − 0S(3) moment 0 map, with the color bar in units of mJy sr−1 km s−1. The crosses indicate the position of the J1356N and J1356S. The South nucleus coincides with a clump of H2. An in-depth analysis of the H2 excitation and kinematics will be presented in Zanchettin et al. (in prep.).
Current usage metrics show cumulative count of Article Views (full-text article views including HTML views, PDF and ePub downloads, according to the available data) and Abstracts Views on Vision4Press platform.
Data correspond to usage on the plateform after 2015. The current usage metrics is available 48-96 hours after online publication and is updated daily on week days.
Initial download of the metrics may take a while.