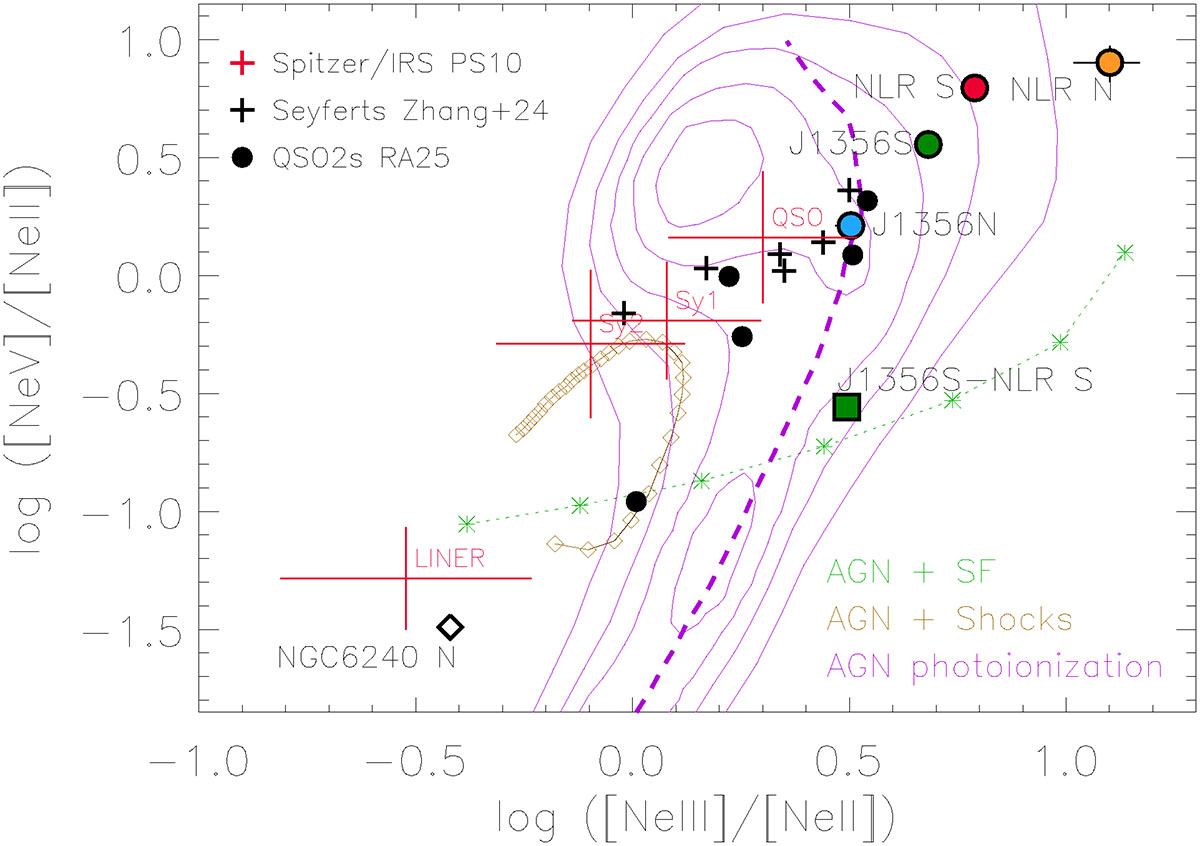
Fig. 3.
Download original image
[Ne V]/[Ne II] vs. [Ne III]/[Ne II] diagram. The ratios corresponding to the spectra in Fig. 2 are shown as blue, green, orange, and pink circles. The NLR-subtracted ratios of J1356S are shown as a green square. The black dots show the QSO2s in RA25, the black crosses show the Seyferts from Zhang et al. (2024), and the open diamond shows the North nucleus of the dual AGN NGC 6240 (Hermosa Muñoz et al. 2025). The red lines indicate the median ratios of QSOs, Seyferts, and LINERs from PS10, measured from Spitzer/IRS spectra. The purple contours delineate the full grid of AGN photoionization models from Feltre et al. (2016), and green asterisks and brown diamonds show the AGN+SF and AGN+shocks models from Feltre et al. (2023) (see Appendix A for details).
Current usage metrics show cumulative count of Article Views (full-text article views including HTML views, PDF and ePub downloads, according to the available data) and Abstracts Views on Vision4Press platform.
Data correspond to usage on the plateform after 2015. The current usage metrics is available 48-96 hours after online publication and is updated daily on week days.
Initial download of the metrics may take a while.