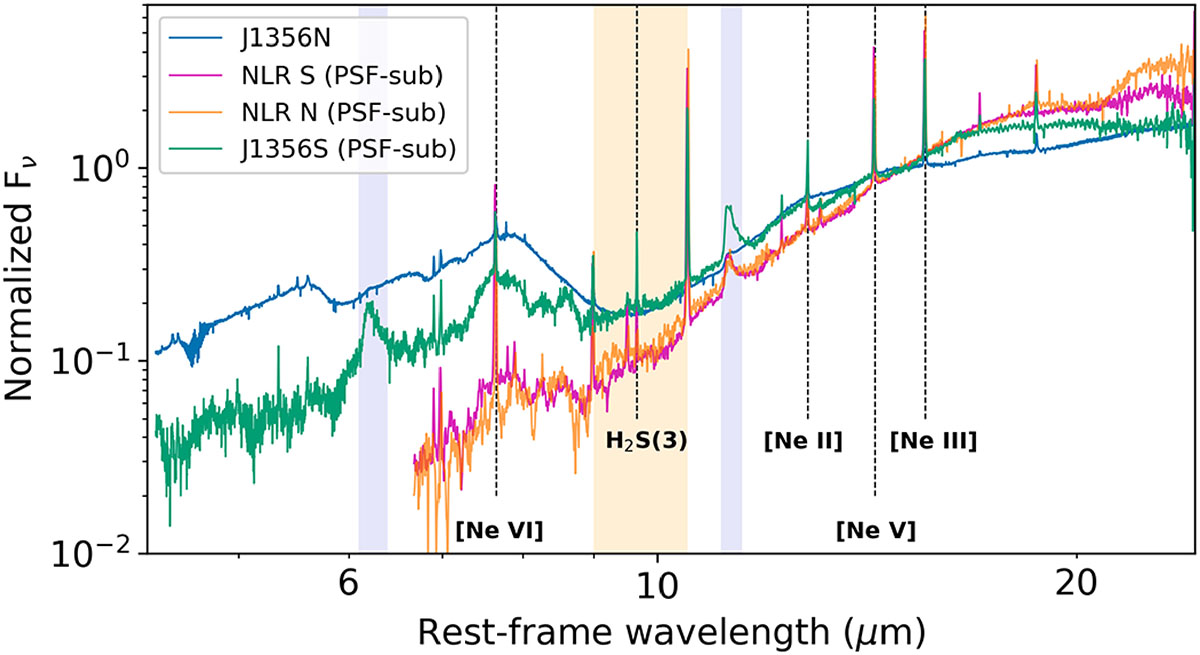
Fig. 2.
Download original image
Spectra from J1356N (blue), J1356S (green), and two NLR locations (pink and orange) extracted in circular apertures with a radius of 0.4″ (shown in Fig. A.1), normalized at 15 μm. The spectrum of J1356N was extracted from the original cubes, and the other spectra were extracted from the PSF-subtracted cubes. The spectra of the NLR could only be extracted from Ch2 to Ch4 because the size of the Ch1 FOV is limited. The emission lines we used are labeled. The purple and yellow shaded regions indicate the 6.2 and 11.3 μm PAHs and the 9.7 μm silicate absorption. For reference, the continuum fluxes at 15 μm of J1356N, J1356S, and NLR S and N are 22.1, 1.31, 0.87, and 0.52 mJy.
Current usage metrics show cumulative count of Article Views (full-text article views including HTML views, PDF and ePub downloads, according to the available data) and Abstracts Views on Vision4Press platform.
Data correspond to usage on the plateform after 2015. The current usage metrics is available 48-96 hours after online publication and is updated daily on week days.
Initial download of the metrics may take a while.