Fig. 1.
Download original image
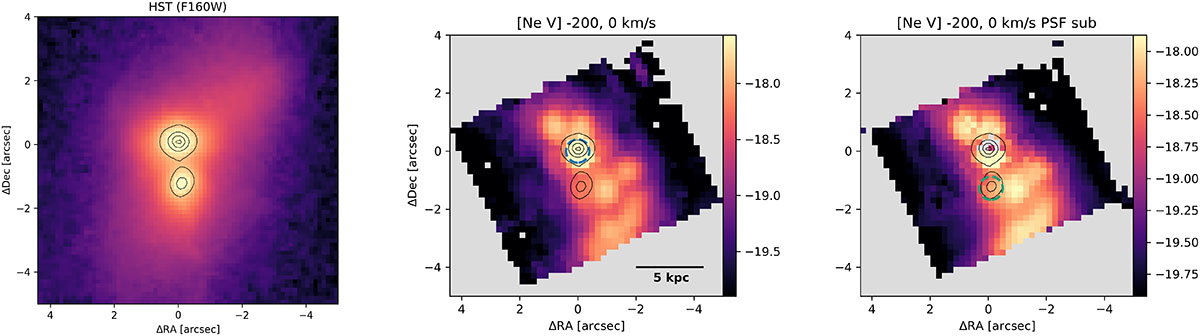
HST/WFC3 F160W image of J1356 in logarithmic scale (left) showing a similar region as the [Ne V] 14.3 μm [−200, 0] km s−1 velocity channel map obtained from the original (center) and PSF-subtracted (right) JWST/MIRI cubes. The zero velocity corresponds to the central wavelength of [Ne V], redshifted to z = 0.1232. The color bar is in units of erg s−1 cm−2. The [Ne V] emission extends to ∼6″ (∼13 kpc) along PA ∼ 30°. The contours correspond to the HST F160W image, where J1356N and J1356S can be clearly identified. The blue and green circles indicate the regions from which the spectra shown in Fig. 2 were extracted.
Current usage metrics show cumulative count of Article Views (full-text article views including HTML views, PDF and ePub downloads, according to the available data) and Abstracts Views on Vision4Press platform.
Data correspond to usage on the plateform after 2015. The current usage metrics is available 48-96 hours after online publication and is updated daily on week days.
Initial download of the metrics may take a while.