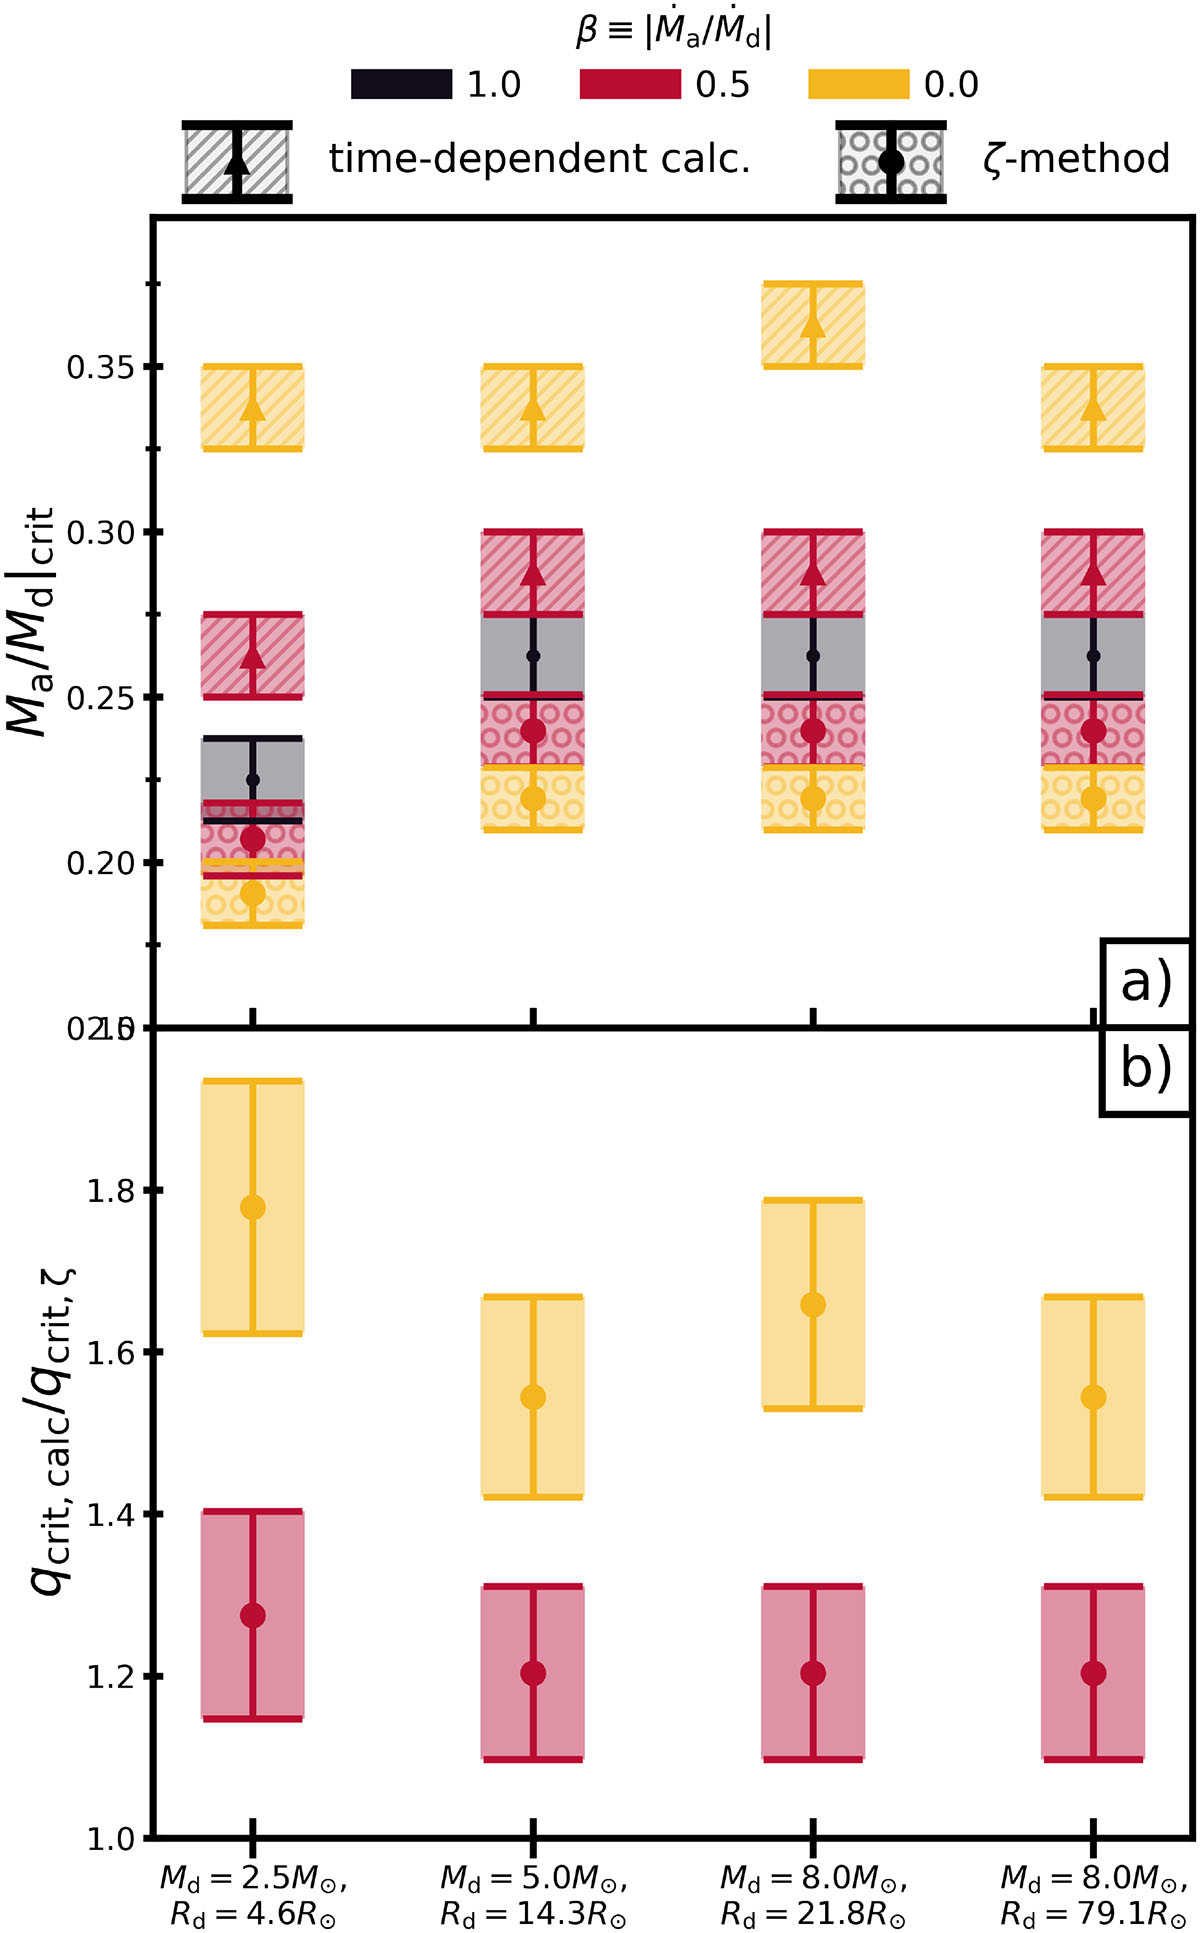
Fig. 2.
Download original image
Comparison of values for the critical mass ratio for stable mass transfer. The four systems correspond to initial periods of approximately Pi ≃ 1.8, 7.1, 10.5, and 72.6 days (for a representative q = 0.25). Panel a shows values for qcrit obtained using the ζ method (qcrit, ζ; sphere hashing) and using MESA calculations (qcrit, calc; diagonal hashing). For β = 1, the two methods coincide by construction, since we calibrate ζd from the conservative borderline and then solve ζL(q,β) = ζd to obtain qcrit,ζ. Panel b shows the ratio of these critical mass ratios qcrit,calc/qcrit,ζ. In both panels, the shaded widths are chosen for readability. The vertical extent indicates the uncertainty owing to the finite bisection resolution. The colours correspond to different mass-transfer efficiencies, as shown in the legend.
Current usage metrics show cumulative count of Article Views (full-text article views including HTML views, PDF and ePub downloads, according to the available data) and Abstracts Views on Vision4Press platform.
Data correspond to usage on the plateform after 2015. The current usage metrics is available 48-96 hours after online publication and is updated daily on week days.
Initial download of the metrics may take a while.