Fig. 6
Download original image
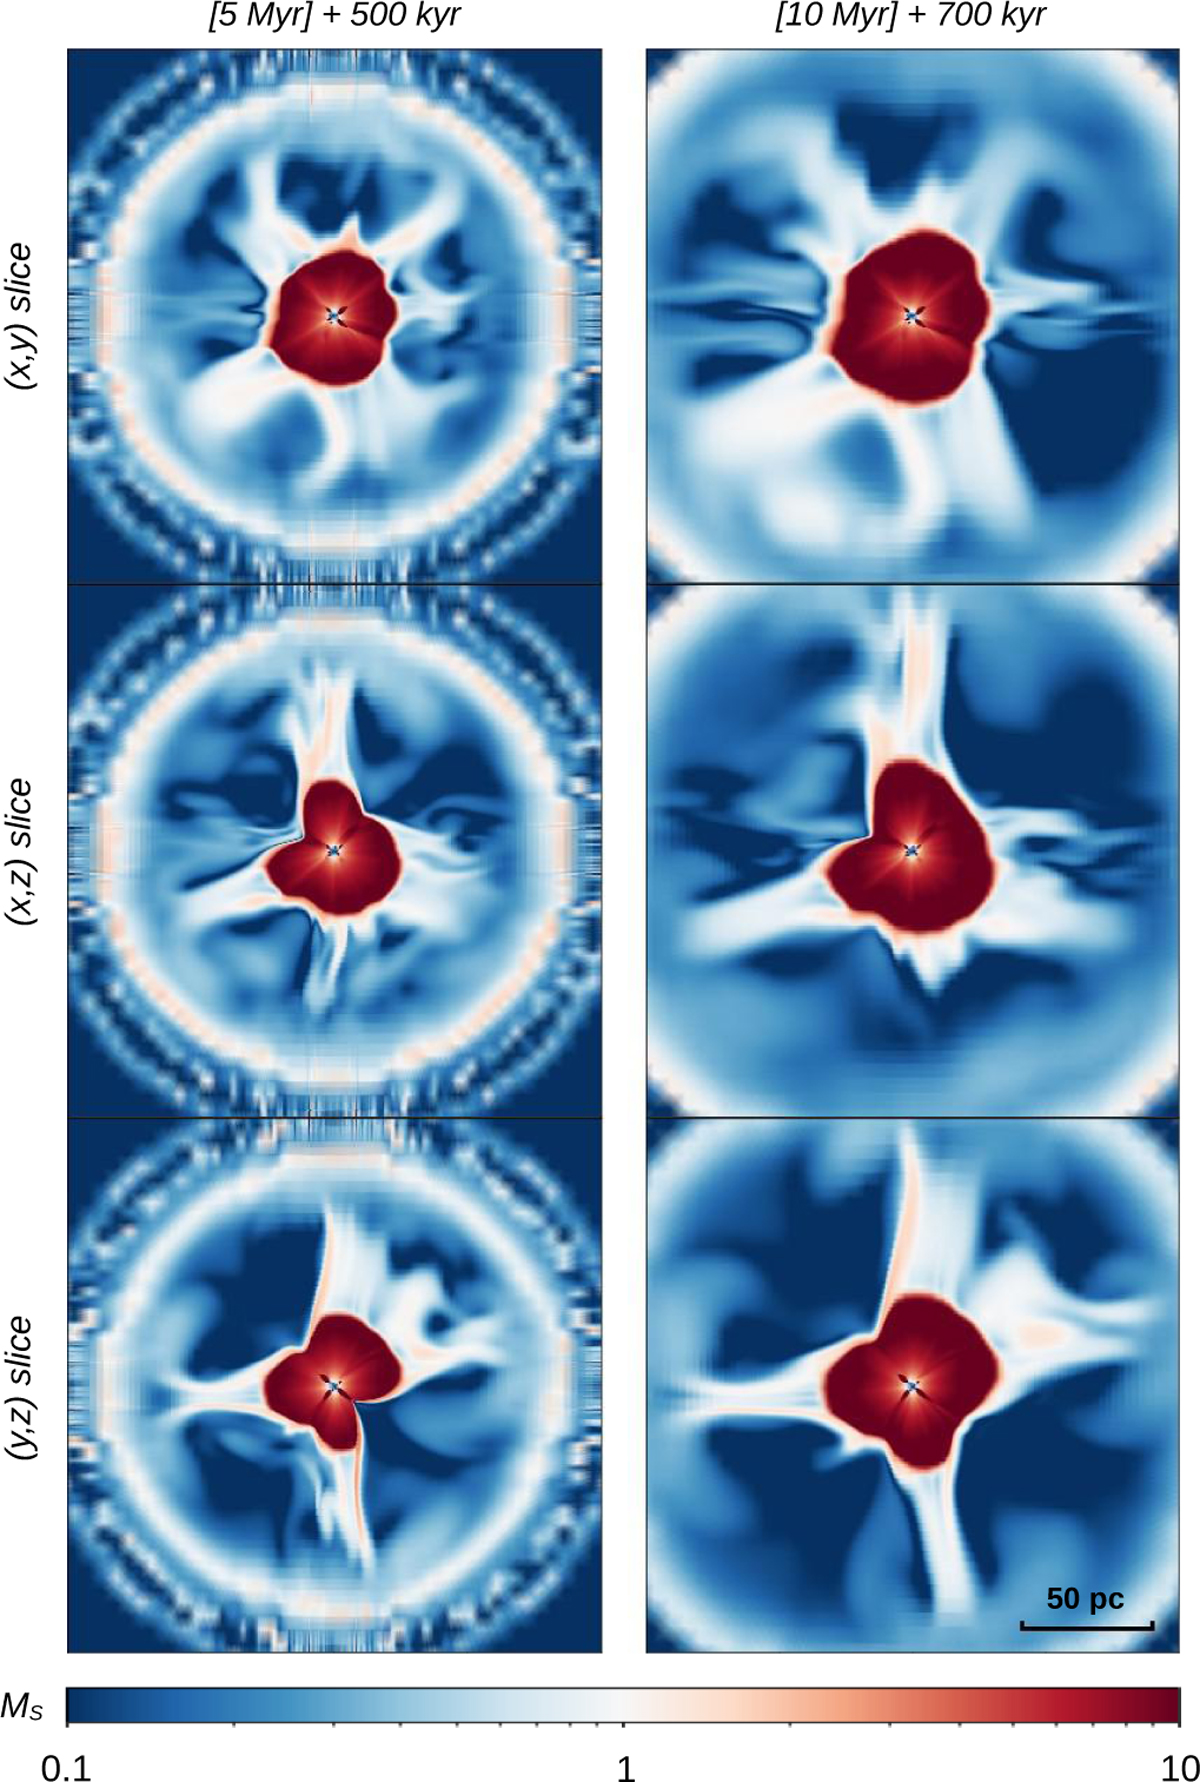
Sonic Mach number solutions obtained starting with a 5 Myr old superbubble ansatz (left) and with a 10 Myr old superbubble ansatz (right). The simulations have converged after 0.5 Myr (left) and 0.7 Myr (right). The three rows show different slices. Note that the figure bounding box is kept the same for all slices: the right panels are not a zoom of the left panels but a simulation of an older cluster.
Current usage metrics show cumulative count of Article Views (full-text article views including HTML views, PDF and ePub downloads, according to the available data) and Abstracts Views on Vision4Press platform.
Data correspond to usage on the plateform after 2015. The current usage metrics is available 48-96 hours after online publication and is updated daily on week days.
Initial download of the metrics may take a while.