Fig. 6.
Download original image
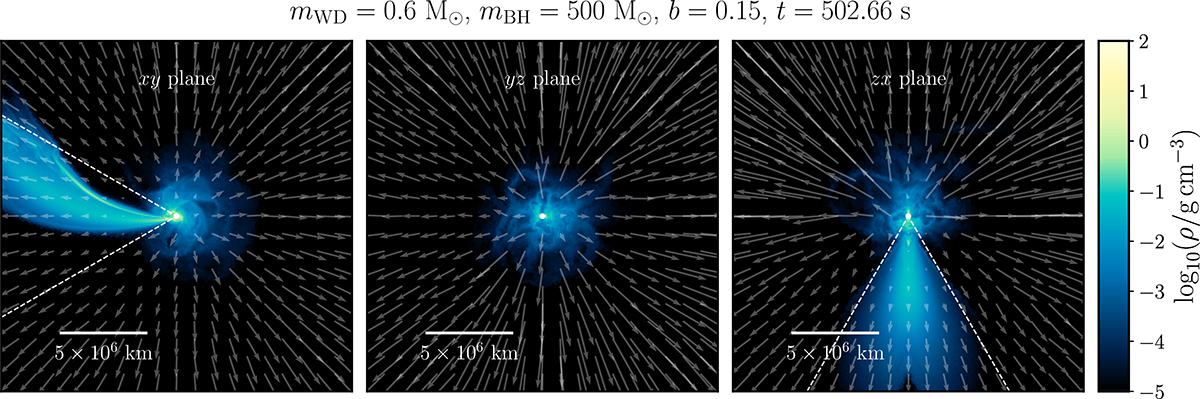
Snapshots of slices of density of a WD TDE with b = 0.15 at ∼500 s. The three panels represent slices, passing through the IMBH, in the xy (left), yz (center), and zx (right) planes. The arrows represent the plane-projected radial velocities of the debris with respect to the IMBH at the plot centers. An arrow as long as the panel side length represents the speed of light. The dashed lines in the left and right columns represent a cone of 30° oriented along the −x direction – this cone contains almost all of the debris from the TDE and the subsequent SN.
Current usage metrics show cumulative count of Article Views (full-text article views including HTML views, PDF and ePub downloads, according to the available data) and Abstracts Views on Vision4Press platform.
Data correspond to usage on the plateform after 2015. The current usage metrics is available 48-96 hours after online publication and is updated daily on week days.
Initial download of the metrics may take a while.