Open Access
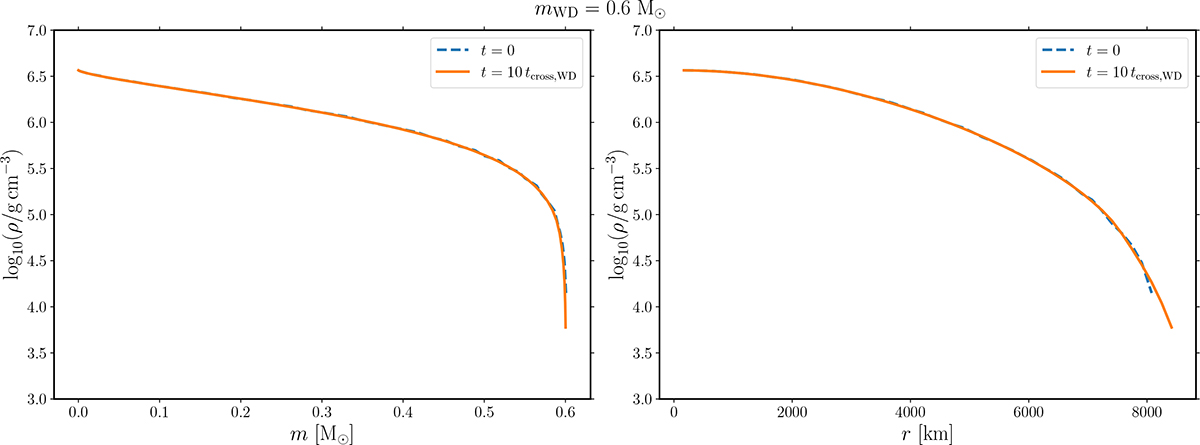
Fig. A.1.
Download original image
Density profiles of the AREPO-initialized 0.6 M⊙ WD (10−7 M⊙/cell resolution) as a function of mass (left) and radial (right) coordinates. The blue dashed and the orange solid lines denote the profiles initially (identical to 1D MESA profile) and after 10 sound-crossing times (∼127 s). The profiles overlap significantly.
Current usage metrics show cumulative count of Article Views (full-text article views including HTML views, PDF and ePub downloads, according to the available data) and Abstracts Views on Vision4Press platform.
Data correspond to usage on the plateform after 2015. The current usage metrics is available 48-96 hours after online publication and is updated daily on week days.
Initial download of the metrics may take a while.