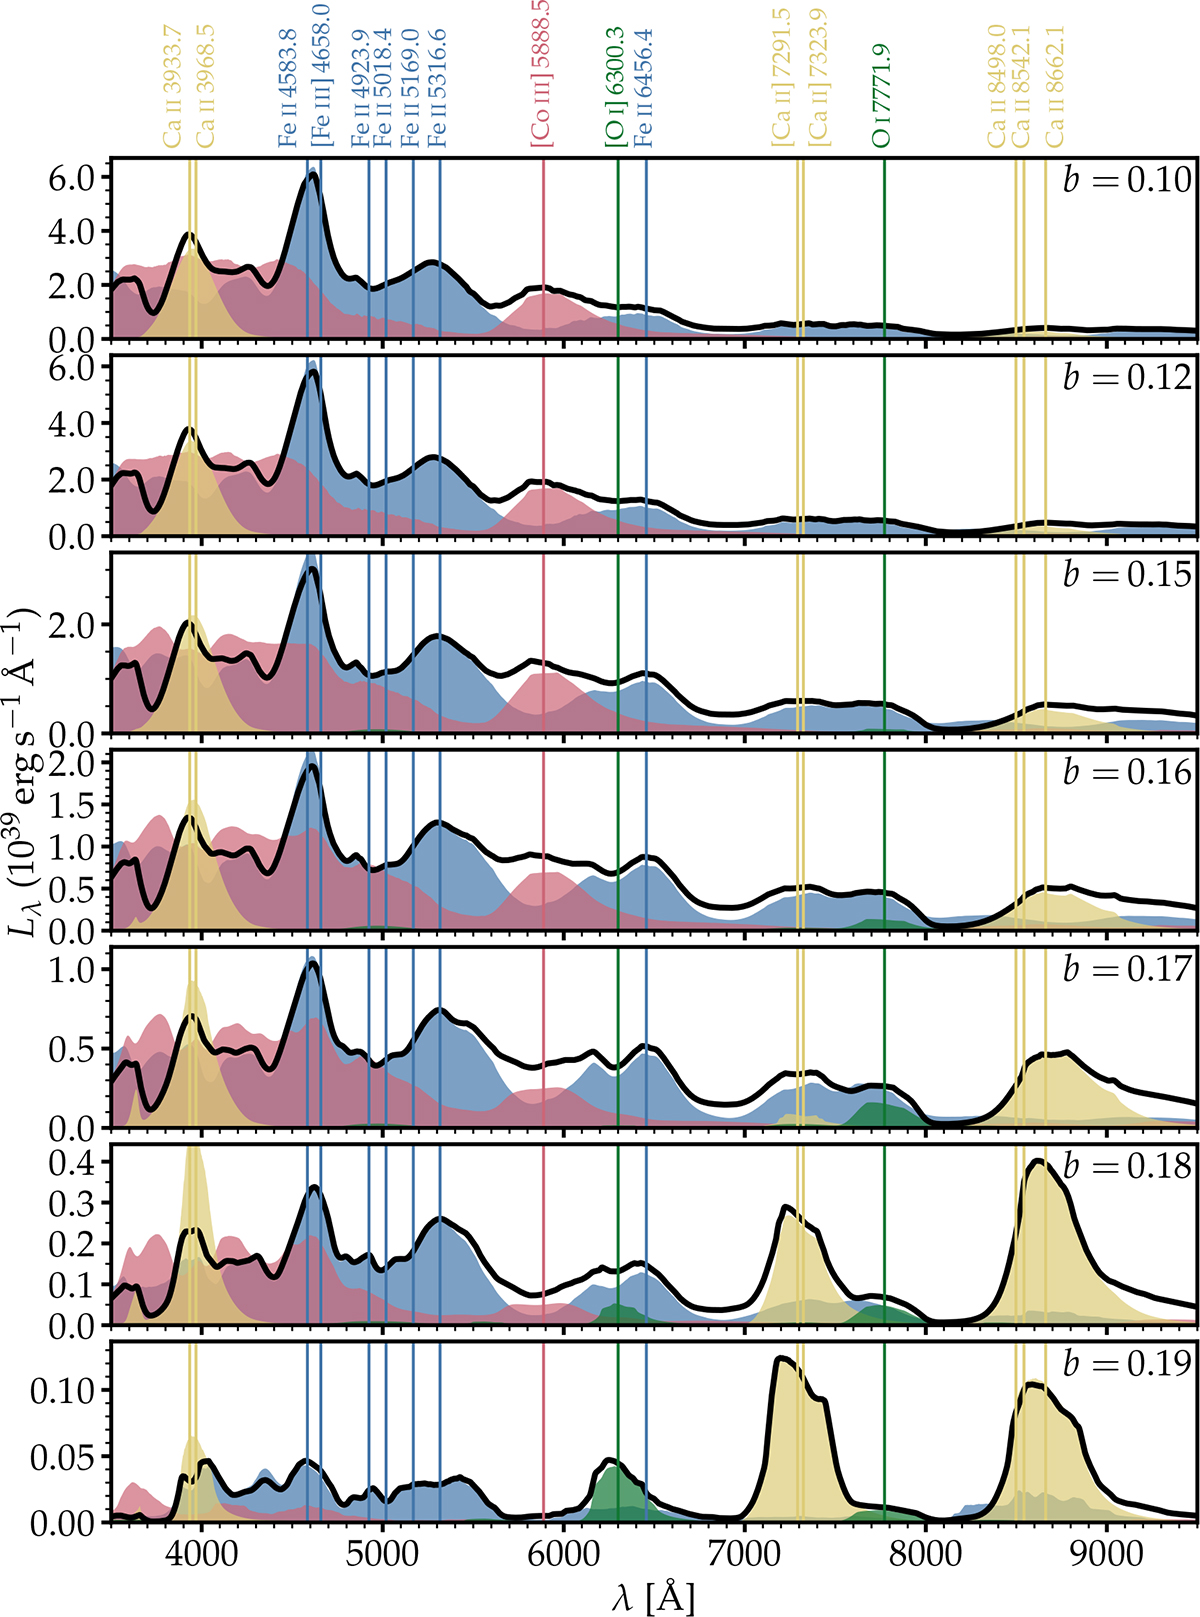
Fig. 11.
Download original image
Montage of spectra for the 1D-equivalent of the 3D models computed with CMFGEN at 100 d after the tidal disruption. A color coding is used to differentiate the emission from O, Ca, Co, and Fe, which dominate at that late time. The spectra of closer encounters with larger 56Ni masses (e.g., b = 0.10) are dominated by Co III and Fe III lines, while those of wider encounters with lower 56Ni masses (e.g., b = 0.19) are dominated by O I and Ca II lines.
Current usage metrics show cumulative count of Article Views (full-text article views including HTML views, PDF and ePub downloads, according to the available data) and Abstracts Views on Vision4Press platform.
Data correspond to usage on the plateform after 2015. The current usage metrics is available 48-96 hours after online publication and is updated daily on week days.
Initial download of the metrics may take a while.