Fig. 4
Download original image
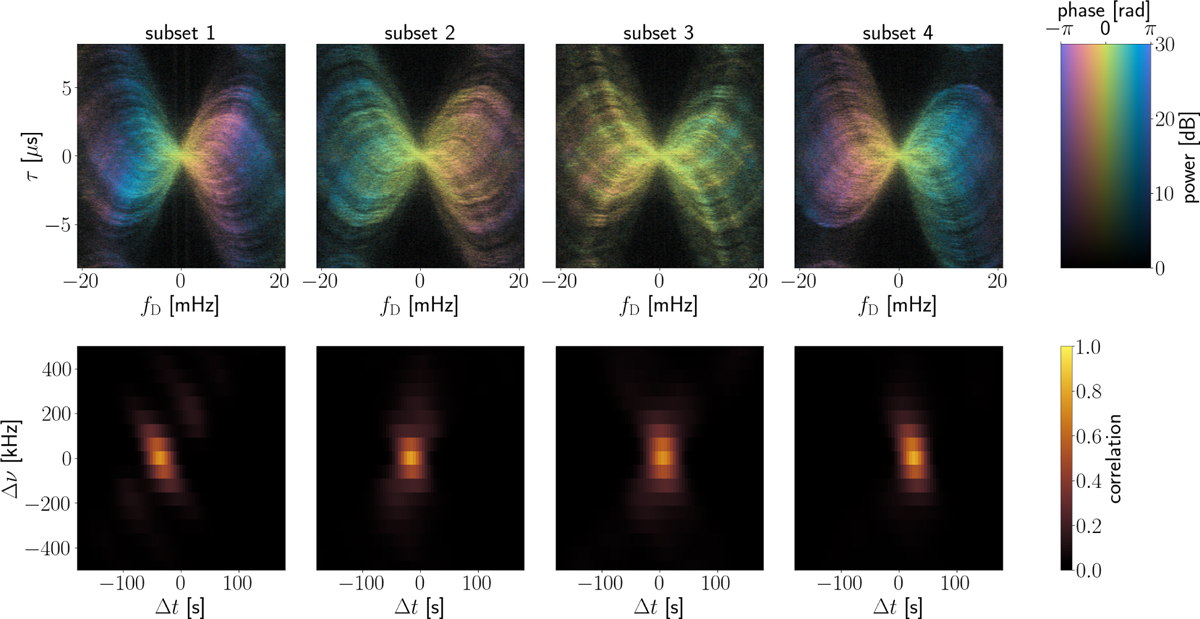
Cross-secondary spectra (top row) and cross-correlations (bottom row) from December 4–5, 2023. The observation has been split into four parts of equal length in time, shown in chronological order. The colors denote the complex phase of the cross-secondary spectra, while their brightness denotes the power. The cross-correlation functions are obtained as the Fourier transform of the cross-secondary spectra. They illustrate the temporal shift corresponding to the linear phase evolution in the cross-spectra.
Current usage metrics show cumulative count of Article Views (full-text article views including HTML views, PDF and ePub downloads, according to the available data) and Abstracts Views on Vision4Press platform.
Data correspond to usage on the plateform after 2015. The current usage metrics is available 48-96 hours after online publication and is updated daily on week days.
Initial download of the metrics may take a while.