Open Access
Fig. 2
Download original image
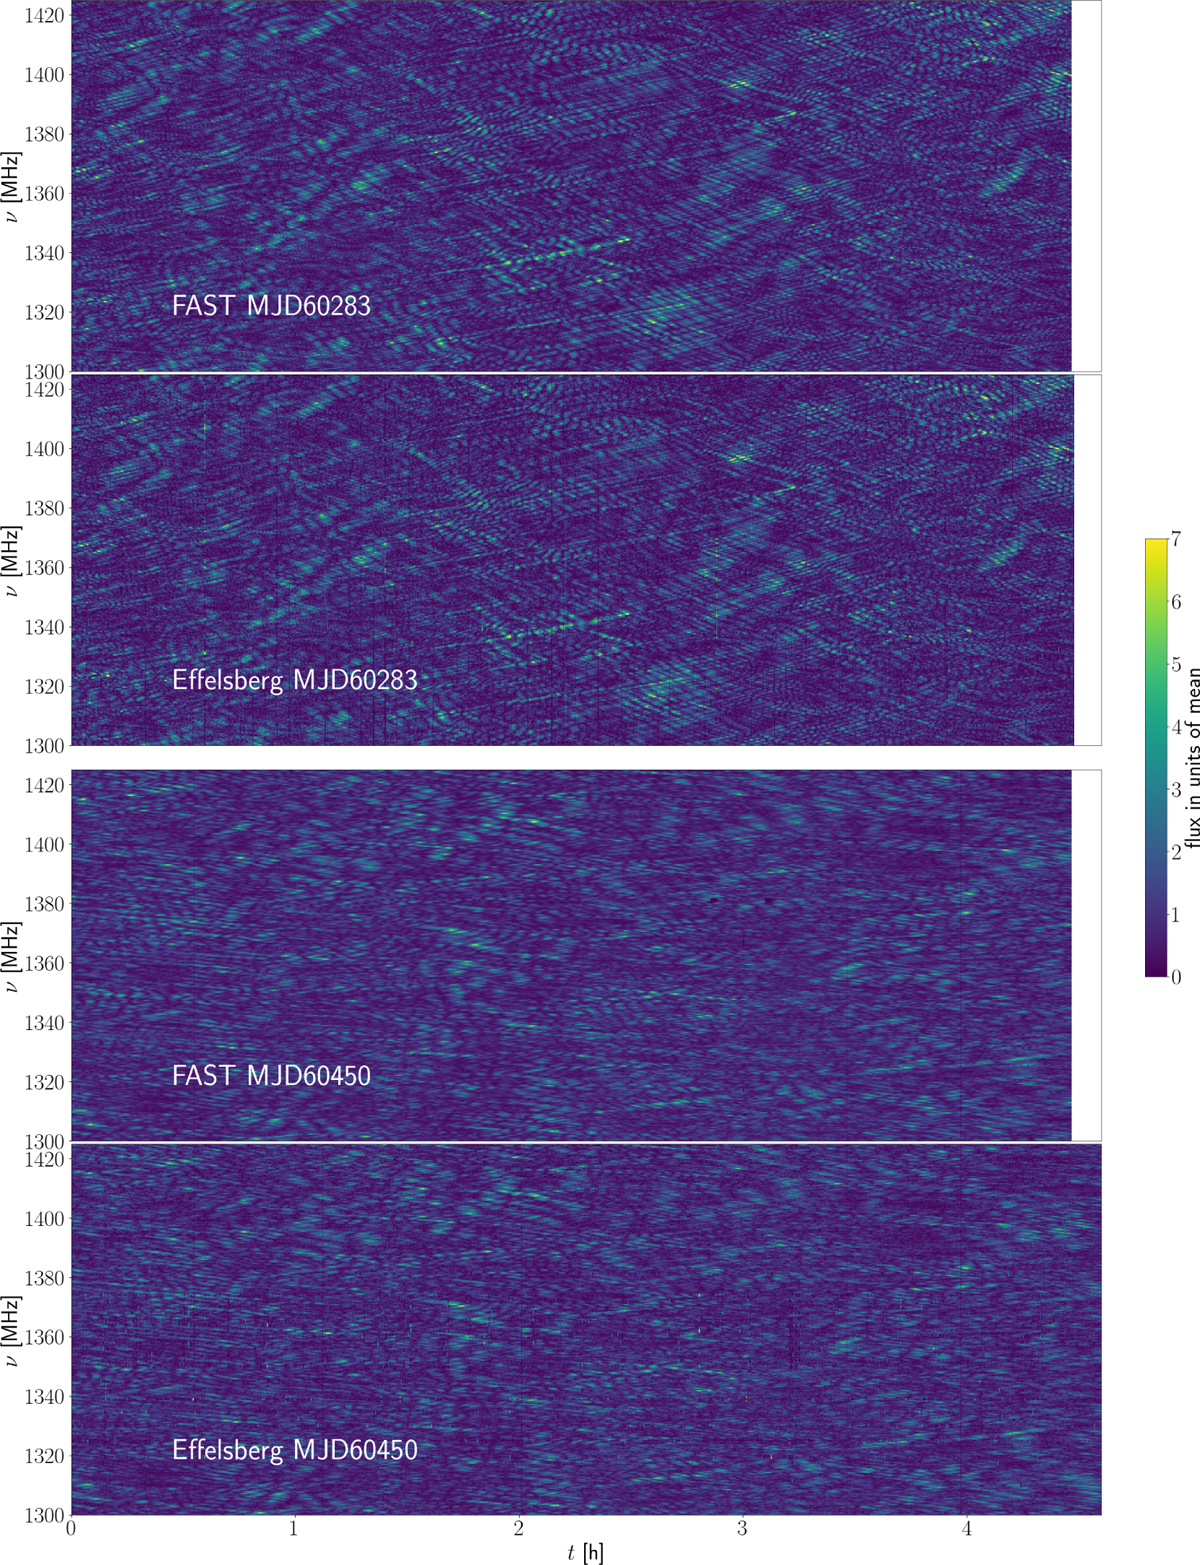
Dynamic spectra of the two simultaneous observations. The data have been normalized to a mean of unity in every time bin and the band has been cut to the optimal subband. The time axis is synchronous and measured from the beginning of simultaneous observations.
Current usage metrics show cumulative count of Article Views (full-text article views including HTML views, PDF and ePub downloads, according to the available data) and Abstracts Views on Vision4Press platform.
Data correspond to usage on the plateform after 2015. The current usage metrics is available 48-96 hours after online publication and is updated daily on week days.
Initial download of the metrics may take a while.