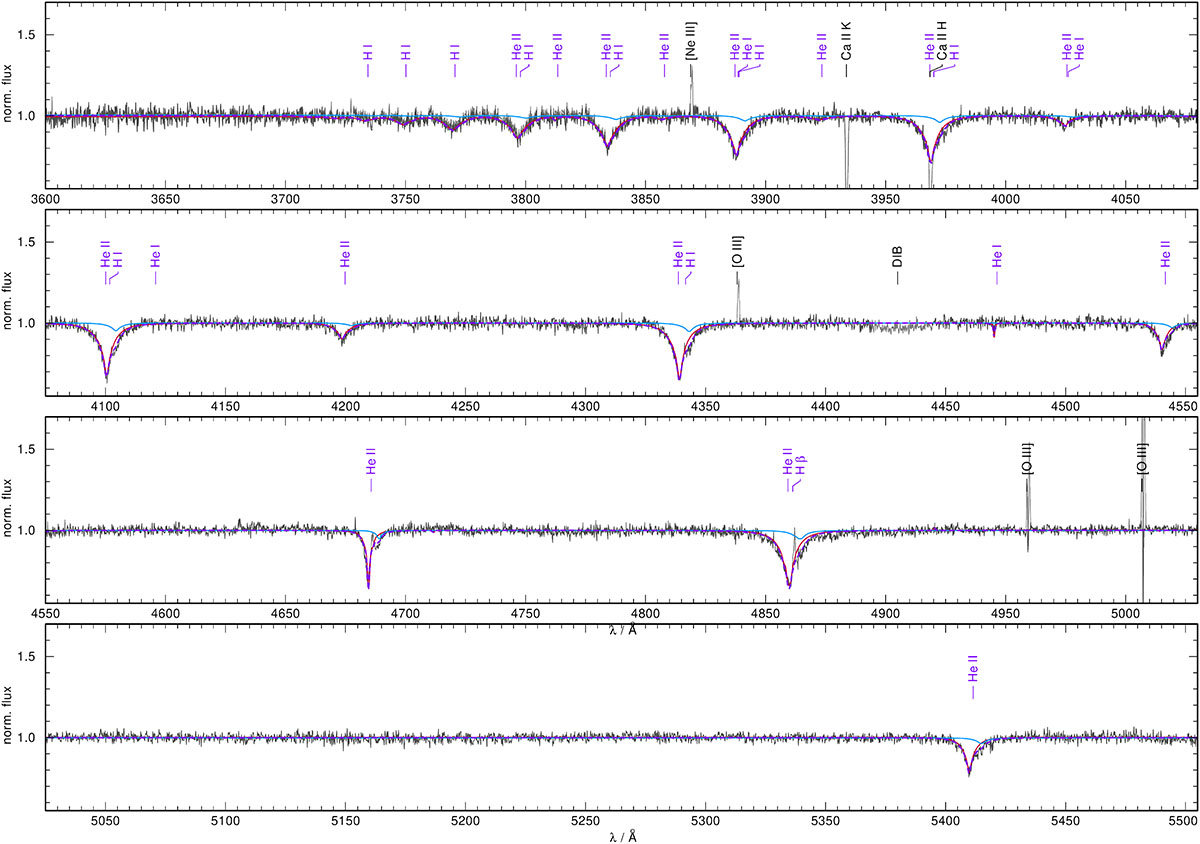
Fig. A.1.
Download original image
UVB X-shooter spectrum taken at phase 0.84 (gray) compared to our best-fitting TMAP models assuming a surface ratio of 0.17. Light gray regions indicate the location of a weak residual nebular and interstellar lines, which have been excluded from the fit. The red and blue lines represent the contribution of Star 1 and Star 2, respectively, and the dashed, purple line shows the combined fit.
Current usage metrics show cumulative count of Article Views (full-text article views including HTML views, PDF and ePub downloads, according to the available data) and Abstracts Views on Vision4Press platform.
Data correspond to usage on the plateform after 2015. The current usage metrics is available 48-96 hours after online publication and is updated daily on week days.
Initial download of the metrics may take a while.