Fig. 5.
Download original image
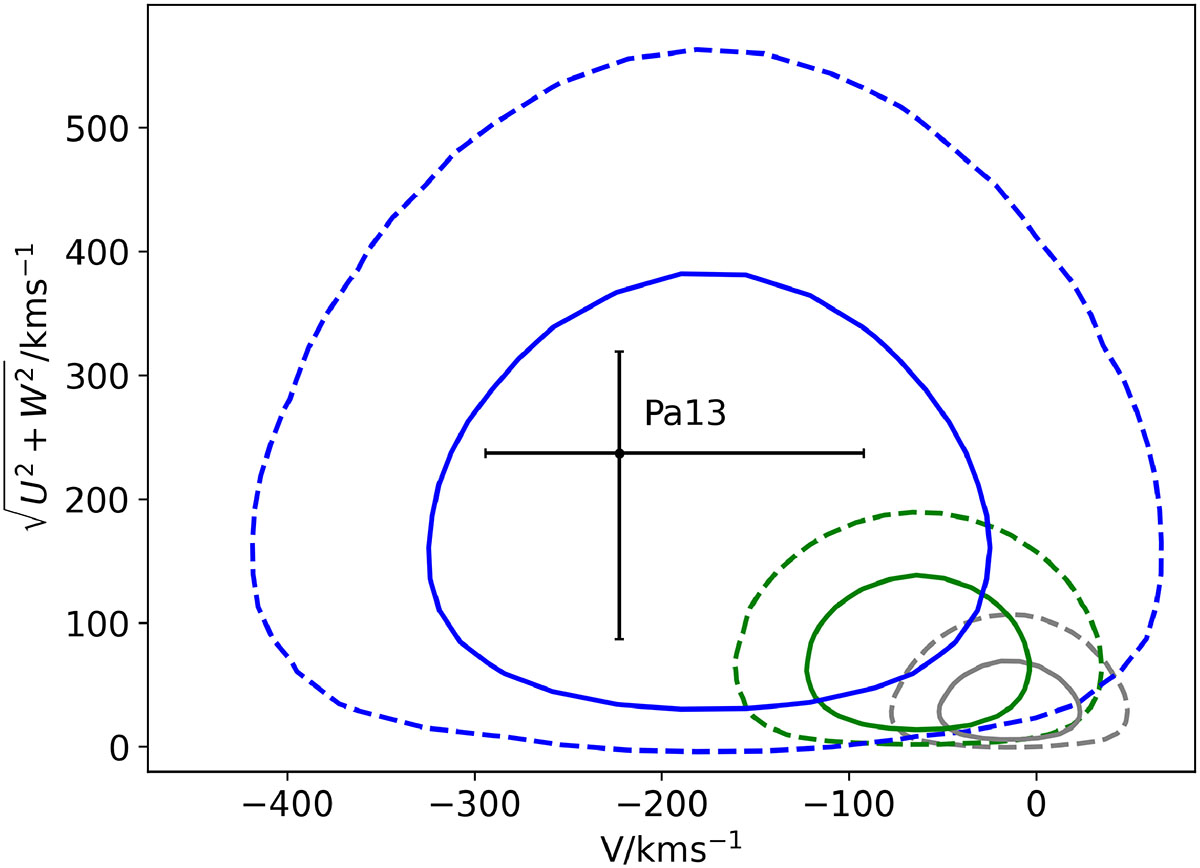
Toomre diagram showing the location of Pa 13. The solid and dashed lines indicate the one- and two-sigma contours, respectively, of the U, V, and W velocity distributions of main-sequence stars from Kordopatis et al. (2011). The gray, green, and blue lines indicate the velocity distribution of thin disk, thick disk, and Galactic halo stars, respectively.
Current usage metrics show cumulative count of Article Views (full-text article views including HTML views, PDF and ePub downloads, according to the available data) and Abstracts Views on Vision4Press platform.
Data correspond to usage on the plateform after 2015. The current usage metrics is available 48-96 hours after online publication and is updated daily on week days.
Initial download of the metrics may take a while.