Fig. 3.
Download original image
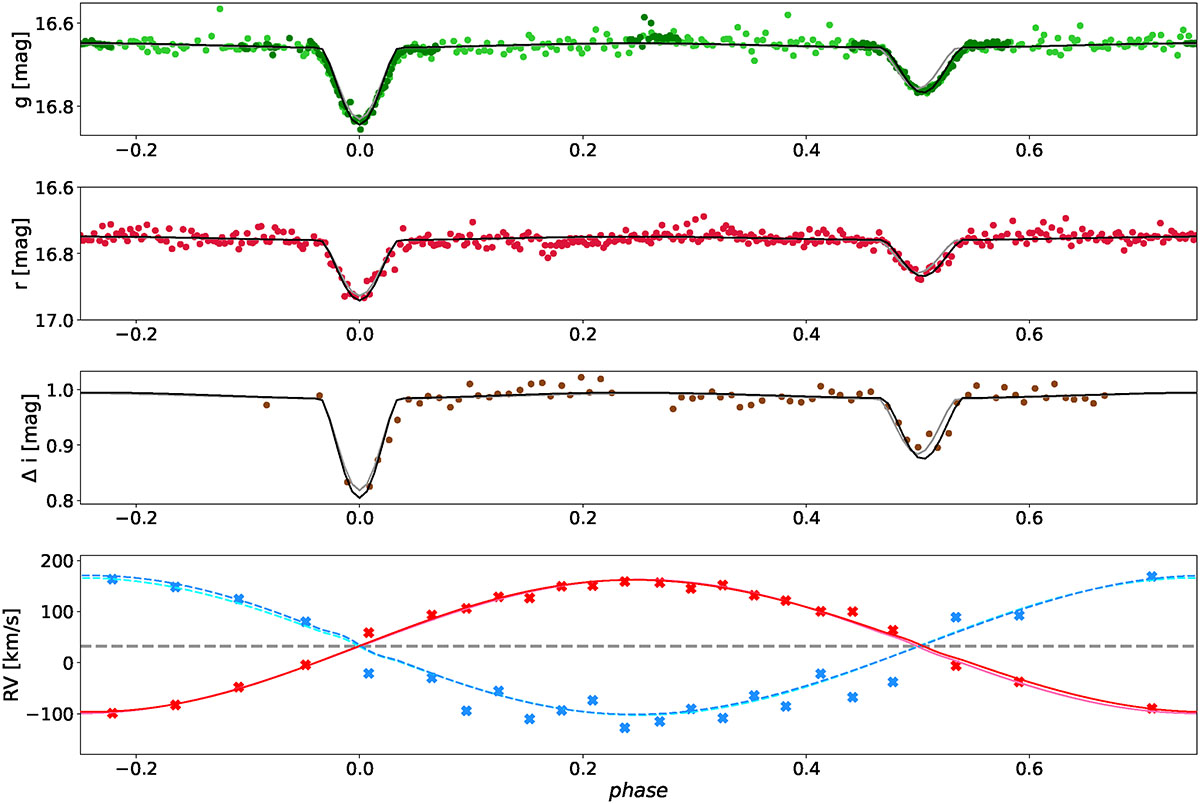
Top three panels: Our best fit eccentric PHOEBE model (black) compared to the observed ZTF g- (green) and r-band (red) and SARA i-band (brown) light curves. The gray line indicates our best model that does not account for eccentricity in the fit. Bottom panel: RVs of Star 1 (red crosses) and Star 2 (blue crosses) as measured assuming a surface ratio of 0.17. The formal fitting error bars for the assumed surface ratio (0.17) are smaller than the symbol sizes. The red and the pink lines indicate the best fit to the RV curve of Star 1 from the eccentric and circular model, respectively. For Star 2 the predicted RV curves from our best fit eccentric and circular model are indicated by the dashed blue and cyan lines, respectively. The gray dashed-dotted line indicates the system velocity.
Current usage metrics show cumulative count of Article Views (full-text article views including HTML views, PDF and ePub downloads, according to the available data) and Abstracts Views on Vision4Press platform.
Data correspond to usage on the plateform after 2015. The current usage metrics is available 48-96 hours after online publication and is updated daily on week days.
Initial download of the metrics may take a while.