


Fig. 4.
Download original image
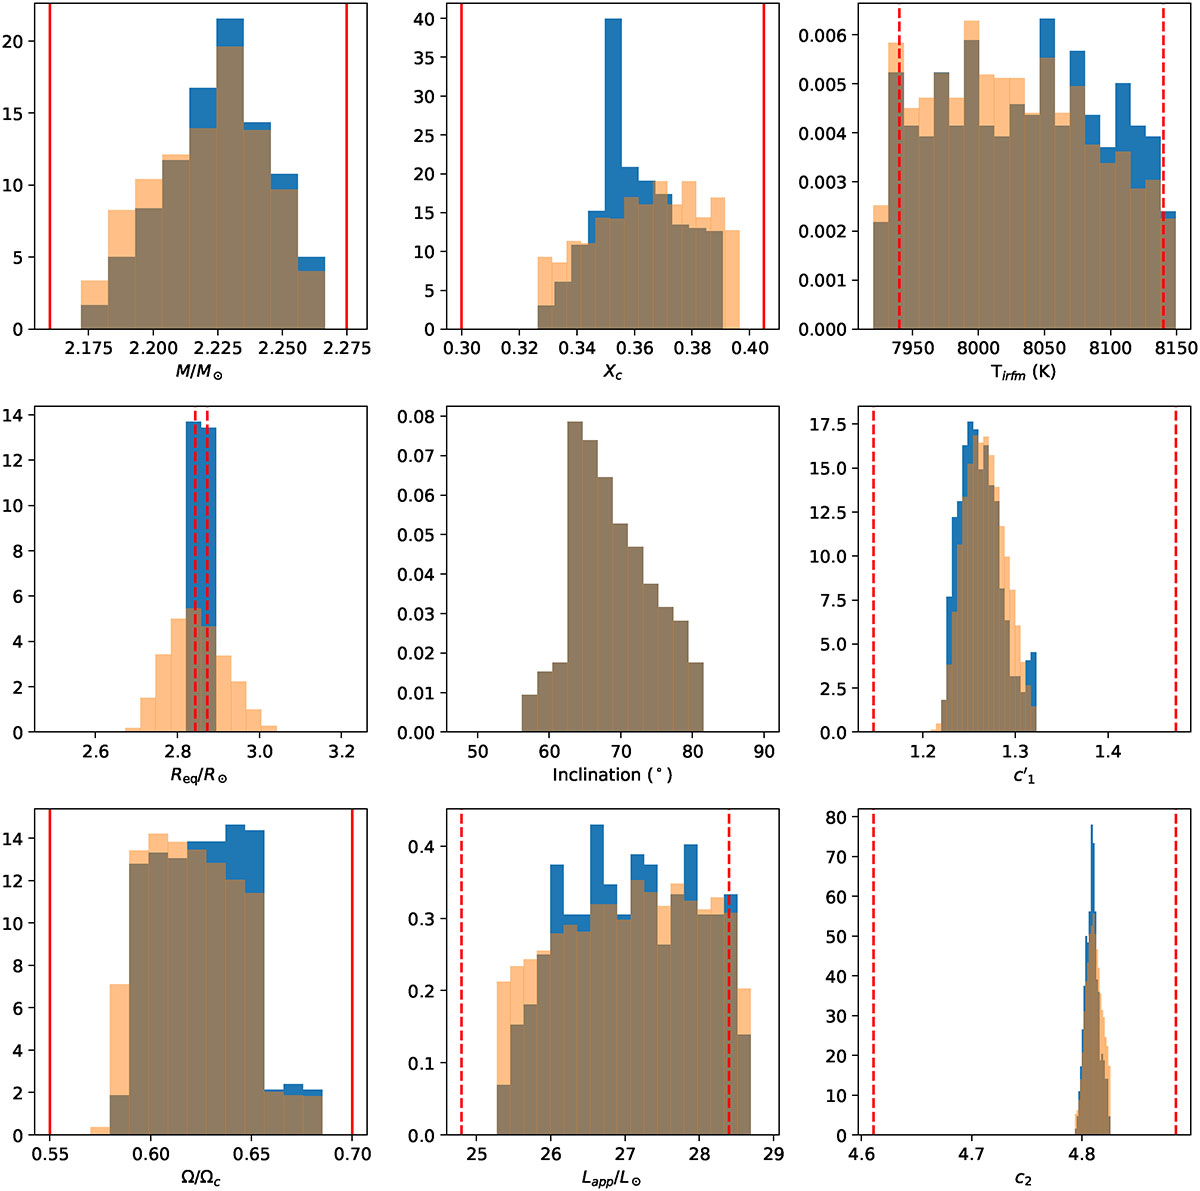
Histograms of the distributions of mass, M; rotation rate with respect to the critical one, Ω/Ωc(=ω); equatorial radius, Req; relative hydrogen mass fraction in the core, Xc; inclination of the rotation axis, i; apparent luminosity, Lapp; and spectroscopic quantities, TIRFM, c′1, and c2. The blue histograms show the distribution when the interferometric constraint on Req from Monnier et al. (2010) is used, while the superimposed orange ones show the distributions when no interferometric constraint is used. Red lines on mass, Ω/Ωc, and Xc show the interval of the parameter that was scanned. Dashed red lines on the observed parameters show the constraints that had to be matched.
Current usage metrics show cumulative count of Article Views (full-text article views including HTML views, PDF and ePub downloads, according to the available data) and Abstracts Views on Vision4Press platform.
Data correspond to usage on the plateform after 2015. The current usage metrics is available 48-96 hours after online publication and is updated daily on week days.
Initial download of the metrics may take a while.