


Fig. 3.
Download original image
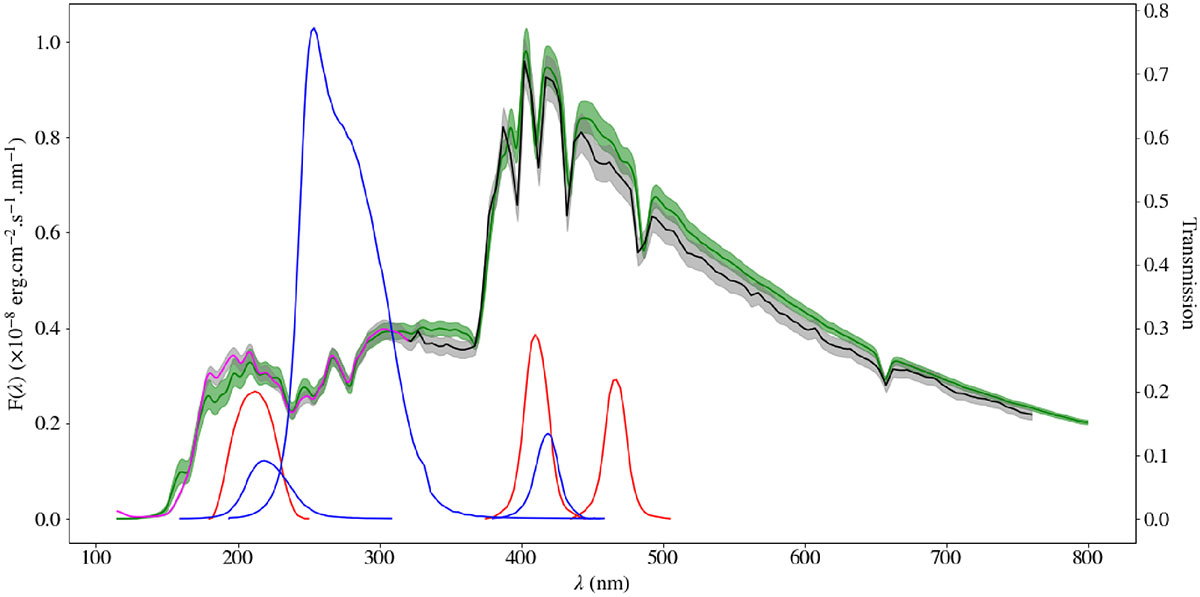
Combined spectra of Rasalhague. The spectrophotometric part #1401 is shown by the solid black line. Its extension towards the UV is in magenta. The 5% uncertainty of these data is shown by the grey zone around the spectrum. The bandpasses of the filters used in the c′1 and c2 indices are shown in red and blue, respectively. The infrared extension is not shown. The green line shows the synthetic spectrum derived from the concordance model given in Table 3. The green zone around this line shows the effect of uncertainties of the rotation axis inclination.
Current usage metrics show cumulative count of Article Views (full-text article views including HTML views, PDF and ePub downloads, according to the available data) and Abstracts Views on Vision4Press platform.
Data correspond to usage on the plateform after 2015. The current usage metrics is available 48-96 hours after online publication and is updated daily on week days.
Initial download of the metrics may take a while.