Fig. 7
Download original image
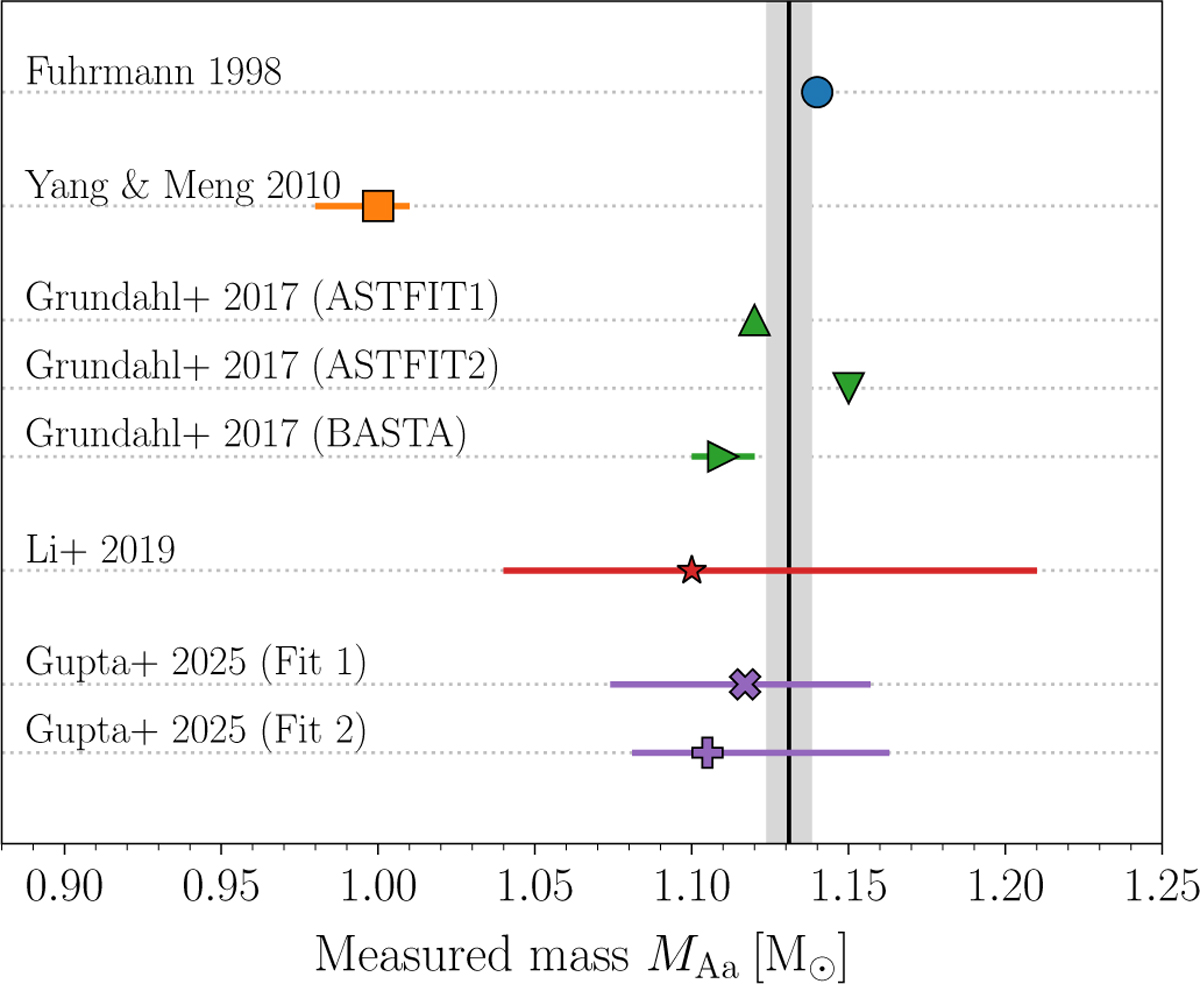
Comparison of the primary mass, MAa, derived in this work (vertical grey band, showing the 1σ credibility interval) against literature values. The markers represent estimates from non-seismic spectroscopy (Fuhrmann 1998), stellar modelling (Yang & Meng 2010; Li et al. 2019), and asteroseismic analyses (Grundahl et al. 2017; Gupta et al. 2025).
Current usage metrics show cumulative count of Article Views (full-text article views including HTML views, PDF and ePub downloads, according to the available data) and Abstracts Views on Vision4Press platform.
Data correspond to usage on the plateform after 2015. The current usage metrics is available 48-96 hours after online publication and is updated daily on week days.
Initial download of the metrics may take a while.