Fig. 6
Download original image
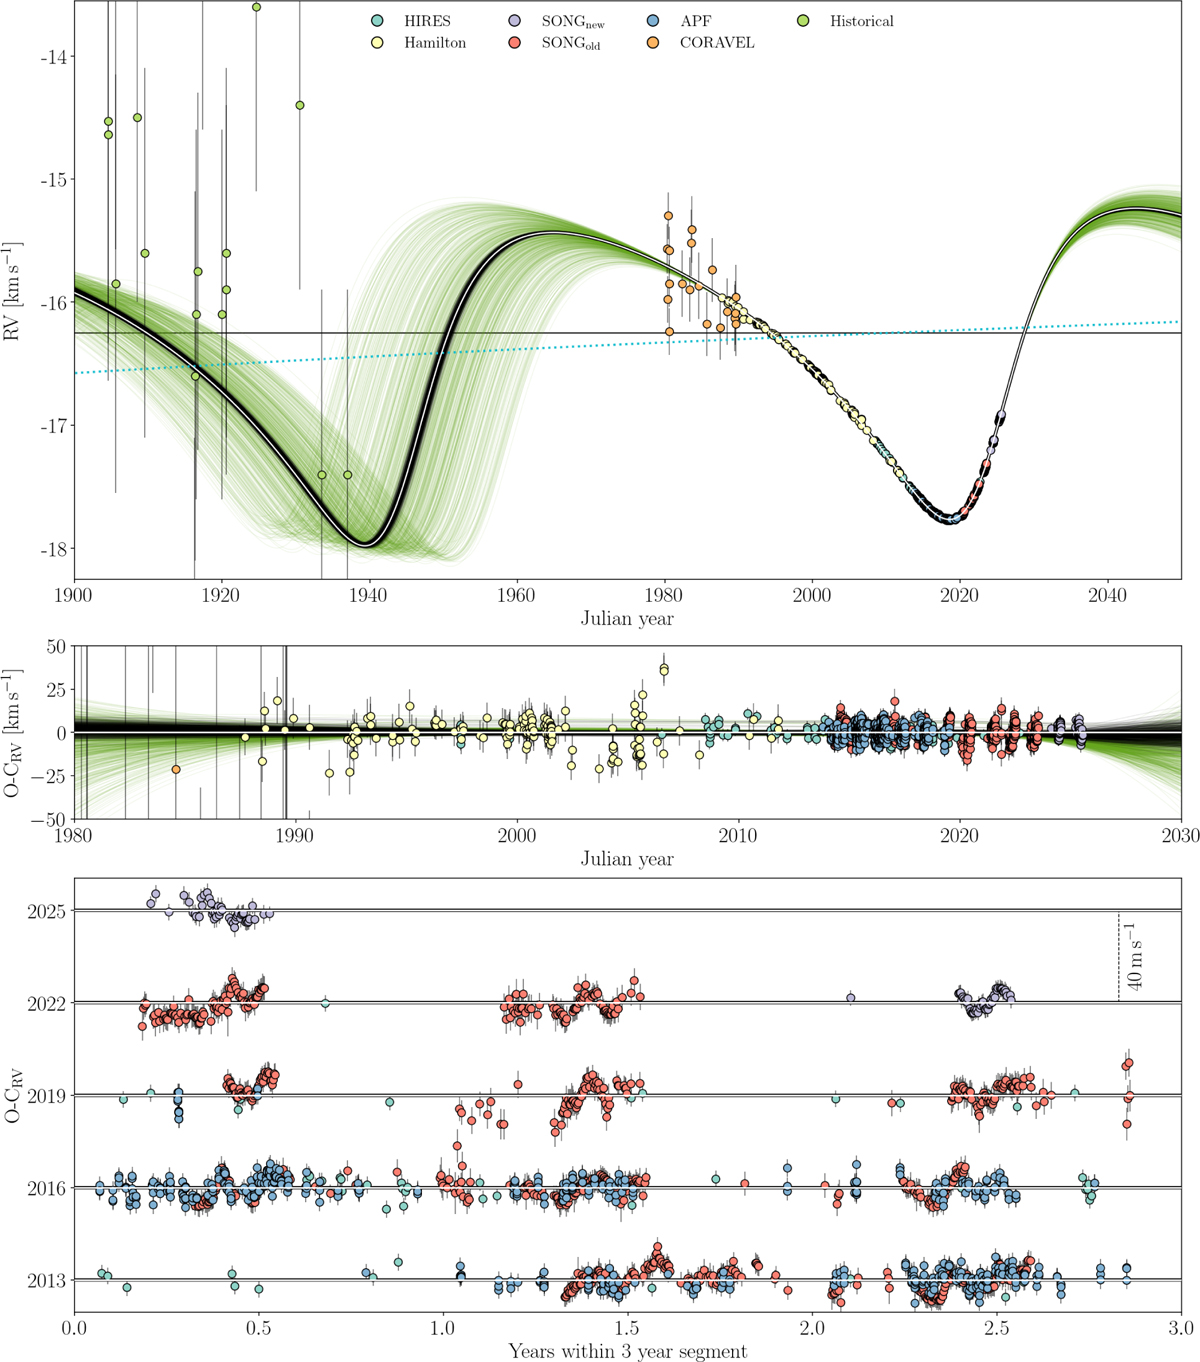
Radial-velocity data and model fits for µ Her Aa. Top: radial velocities versus time. The points are coloured by instrument (see legend). Note that SONG RVs are nightly medians. Green curves represent random draws from the posterior of the RV-only solution, while black curves depict the joint solution; the median joint model is overlaid in white. The dashed lines trace the long-term trends: the green line indicates the best-fitting linear trend for the RV-only solution, while the black line follows the reflex motion induced by the A–BC orbit in the joint fit. Middle: residuals relative to the median joint model. The error bars include jitter. Bottom: residuals in three-year segments. To visualise the dense time series, residuals are displayed in three-year segments, starting from the year indicated on the left side of the plot and vertically offset by 40 ms−1.
Current usage metrics show cumulative count of Article Views (full-text article views including HTML views, PDF and ePub downloads, according to the available data) and Abstracts Views on Vision4Press platform.
Data correspond to usage on the plateform after 2015. The current usage metrics is available 48-96 hours after online publication and is updated daily on week days.
Initial download of the metrics may take a while.