Fig. 3
Download original image
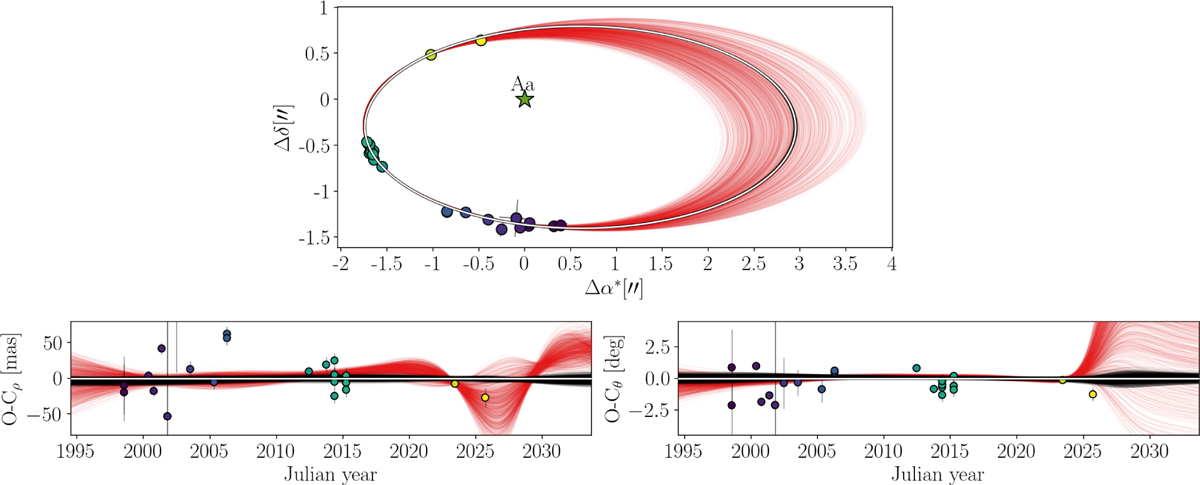
Relative astrometry of the µ Her A subsystem. The plot is centred on the primary µ Her Aa. Data points are colour-coded by epoch, progressing from purple to yellow. To illustrate the constraints provided by relative astrometry alone, we display 600 random draws from the corresponding posterior distribution (red traces). The solid black lines trace the orbit derived from our full joint fit, with the median solution highlighted in white. The bottom panels show residuals versus time in separation, ρ, and position angle, θ.
Current usage metrics show cumulative count of Article Views (full-text article views including HTML views, PDF and ePub downloads, according to the available data) and Abstracts Views on Vision4Press platform.
Data correspond to usage on the plateform after 2015. The current usage metrics is available 48-96 hours after online publication and is updated daily on week days.
Initial download of the metrics may take a while.