Fig. 1.
Download original image
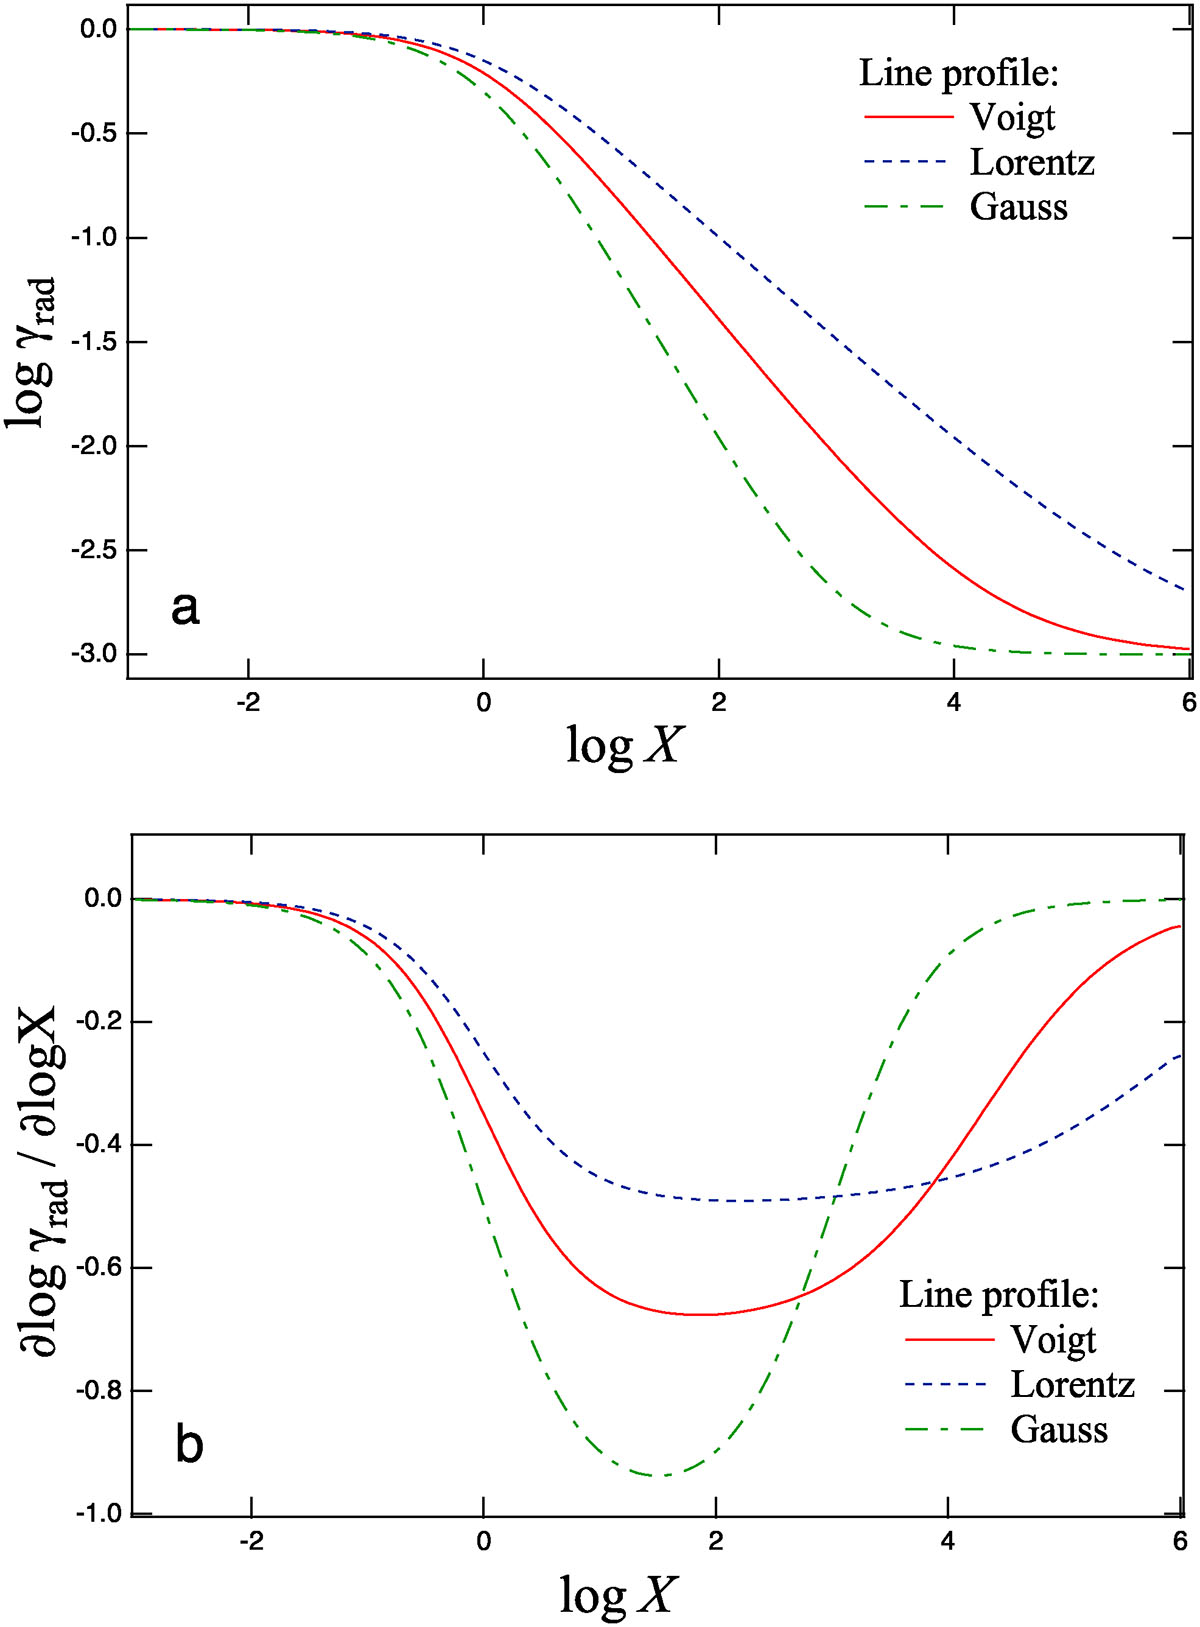
Behaviour of grad for a single atomic line with respect to the relative concentration of the considered ion (see text). The dashed line is for a Lorentzian profile (α = −0.5), the dash-dotted line is the approximation for a Gaussian profile (α = −1.0), and the continuous line mimics the case of a Voigt profile (α = −0.7). Panel (a): γrad (the dimensionless normalized grad) vs X (the logarithm of the dimensionless normalized concentration). Panel (b): Logarithmic derivative of γrad. The minimum value is close to the exponent α. The increase in the derivative after the minimum depends on the value assumed for the contribution of photoionisation to grad; here it is set to 10−3 (see details in Alecian & LeBlanc 2000).
Current usage metrics show cumulative count of Article Views (full-text article views including HTML views, PDF and ePub downloads, according to the available data) and Abstracts Views on Vision4Press platform.
Data correspond to usage on the plateform after 2015. The current usage metrics is available 48-96 hours after online publication and is updated daily on week days.
Initial download of the metrics may take a while.