


Fig. 2
Download original image
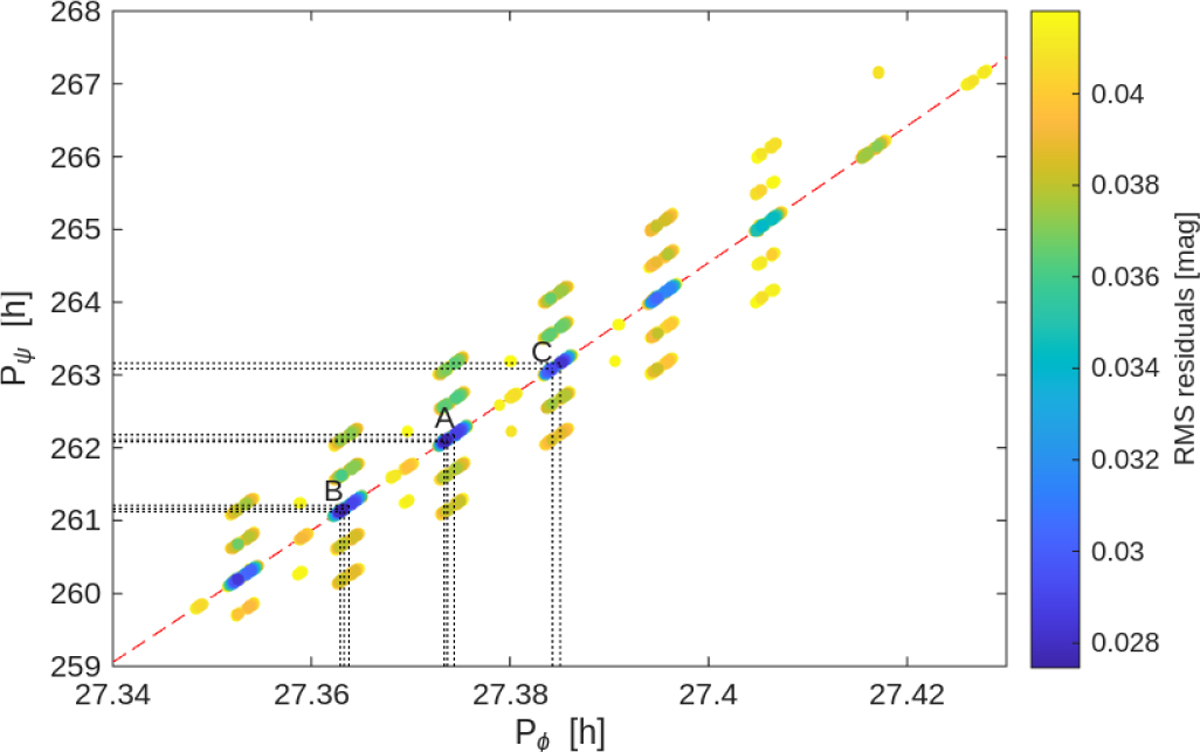
Period scan. The plot shows the same data as in Fig. 1, but here the RMS residuals are color coded, and both the precession period Pϕ and rotation period Pψ are plotted to visualize the correlation between them. The best solutions with the lowest residuals (blue color) lie on the red dashed line that is in fact part of a hyperbola satisfying the relation ![Mathematical equation: $\[(P_{\phi}^{-1}-P_{\psi}^{-1})^{-1}=30.5658 \mathrm{~h}\]$](/articles/aa/full_html/2026/05/aa58974-26/aa58974-26-eq2.png) .
.
Current usage metrics show cumulative count of Article Views (full-text article views including HTML views, PDF and ePub downloads, according to the available data) and Abstracts Views on Vision4Press platform.
Data correspond to usage on the plateform after 2015. The current usage metrics is available 48-96 hours after online publication and is updated daily on week days.
Initial download of the metrics may take a while.