


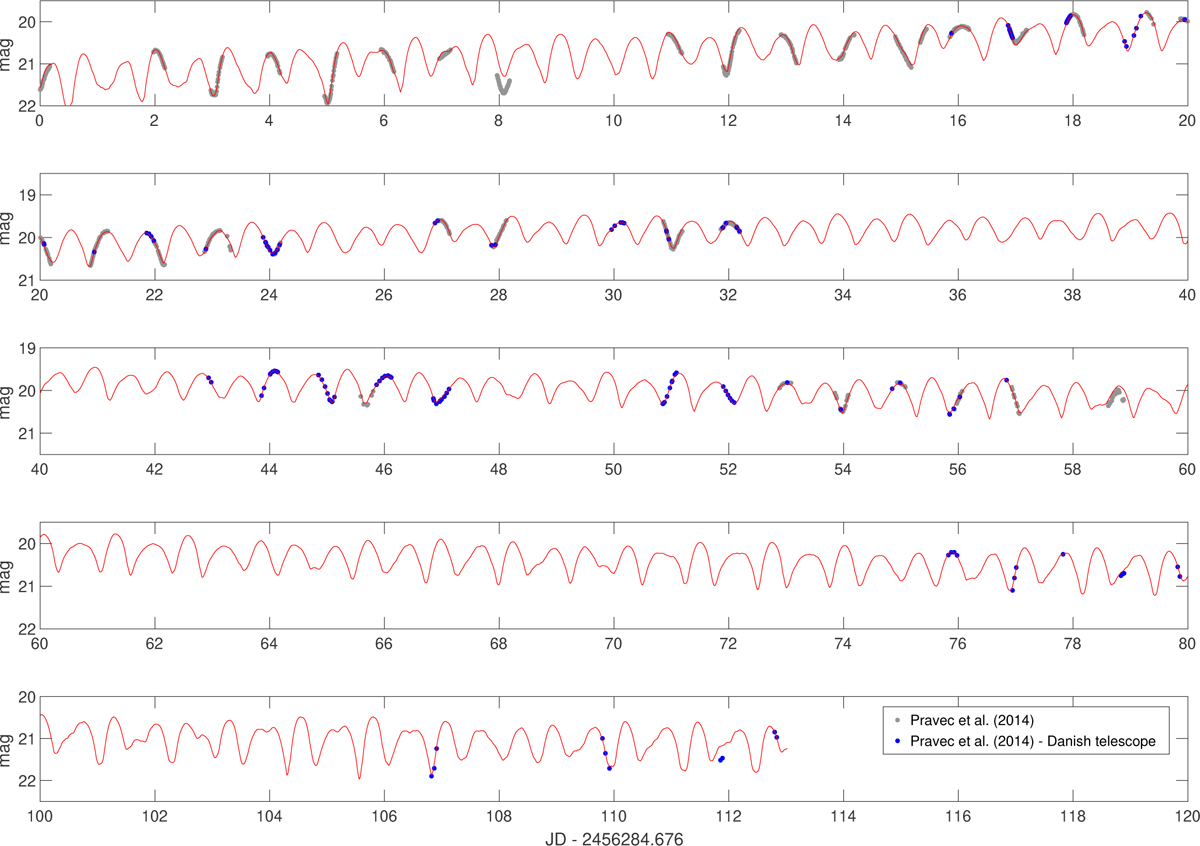
Fig. B.1
Download original image
Fit of the model to the photometric data from 2012–2013. The red curve is the synthetic light curve produced by model A*. The points are photometric measurements published by Pravec et al. (2014). The blue color marks the accurately calibrated subset observed with the Danish telescope, which was used to reconstruct model A. Some of the grey light curves, which were taken with other telescopes, are shifted with respect to the model due to their imperfect photometric calibrations. The vertical axis is the Cousins R reduced to the unit distances from Earth and Sun.
Current usage metrics show cumulative count of Article Views (full-text article views including HTML views, PDF and ePub downloads, according to the available data) and Abstracts Views on Vision4Press platform.
Data correspond to usage on the plateform after 2015. The current usage metrics is available 48-96 hours after online publication and is updated daily on week days.
Initial download of the metrics may take a while.