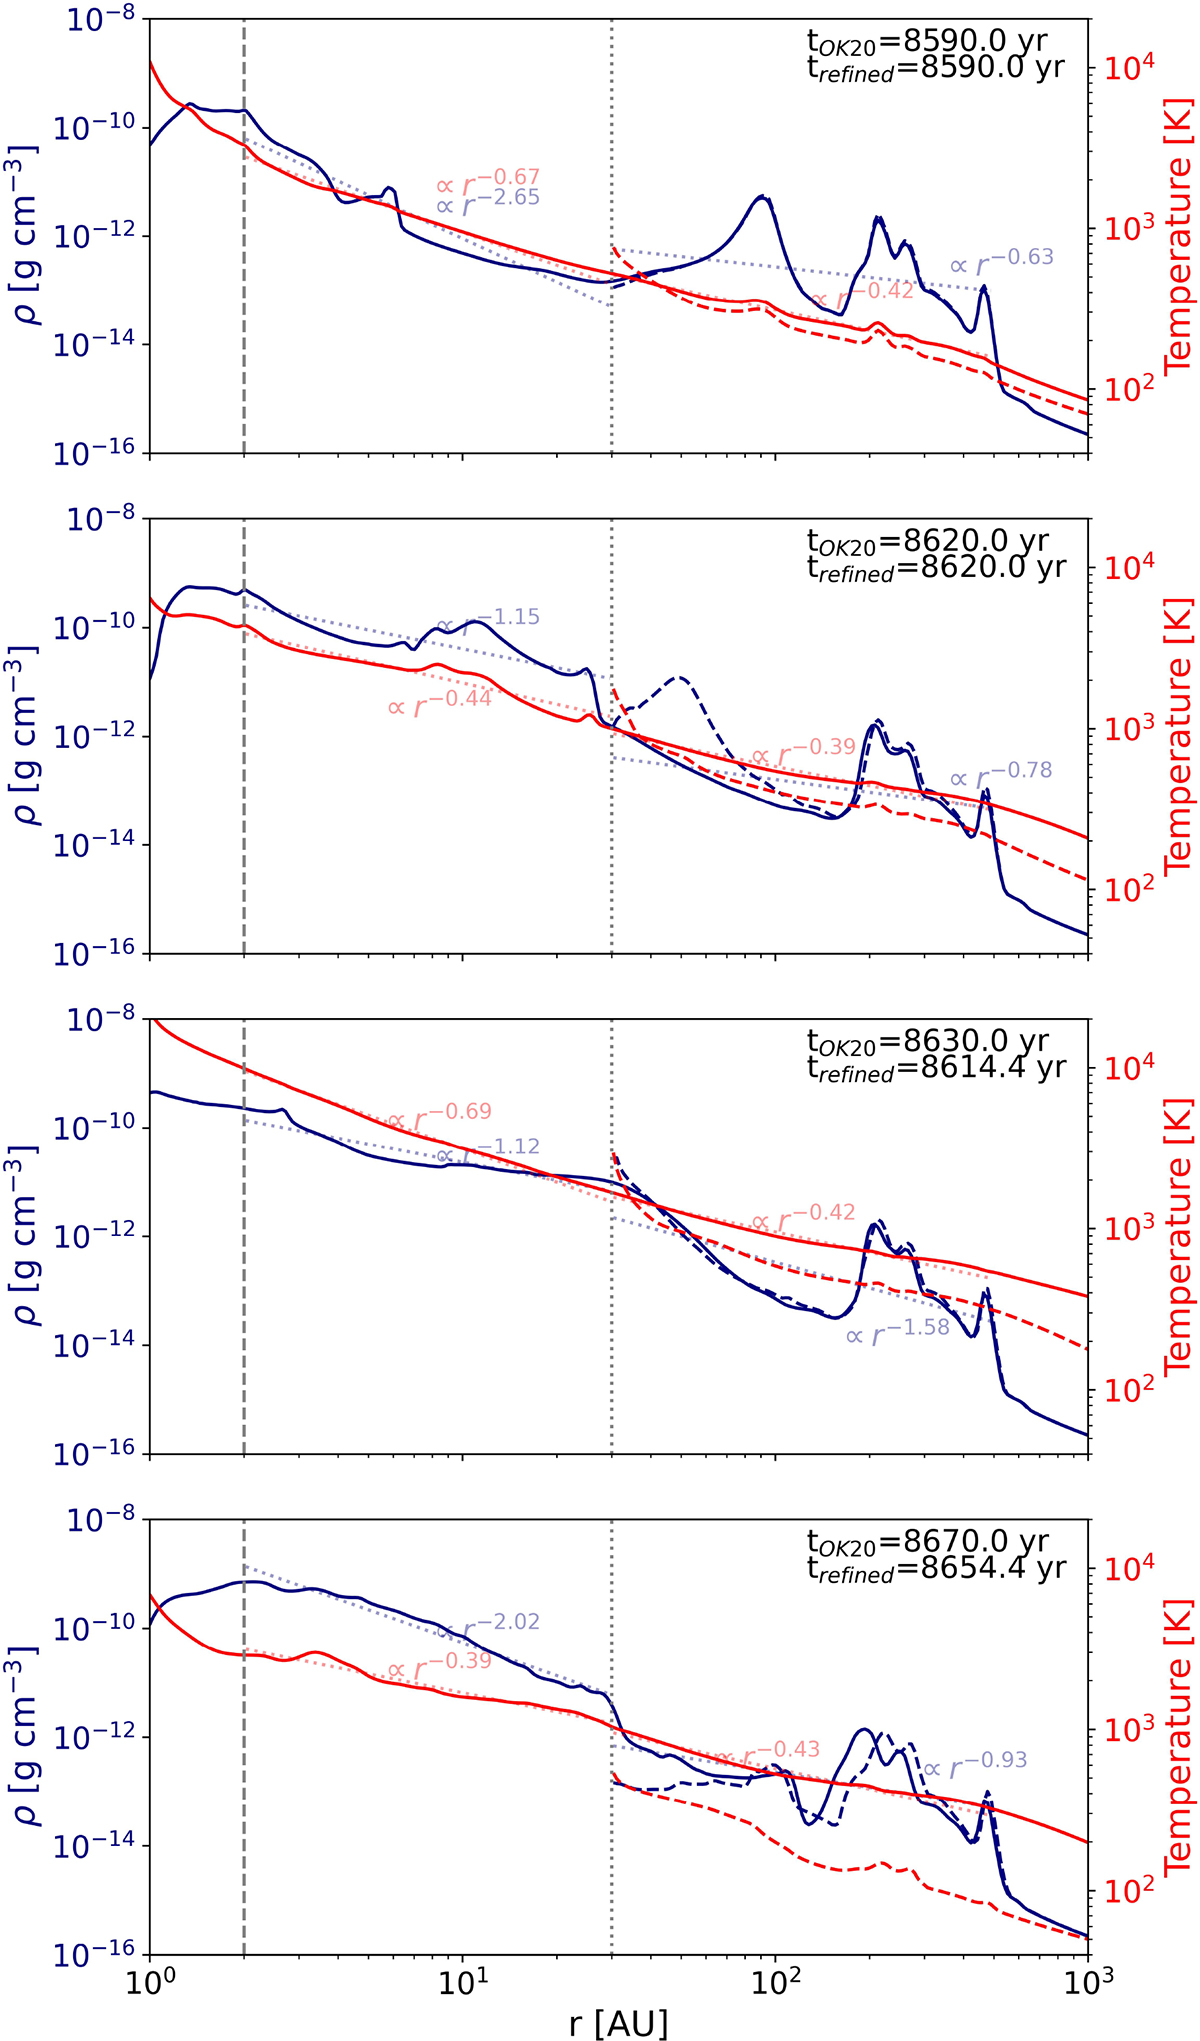
Fig. 6.
Download original image
Azimuthally averaged midplane radial profiles of gas density (left y-axis) and temperature (right y-axis) for paired output times from the OK20 run (dashed) and the refined run (solid). Power-law fits (dotted) are shown for two radial ranges: 2–30 AU and 30–500 AU, with fitted exponents annotated at representative radii. Vertical lines mark 2 AU and 30 AU, separating the inner fit region from the outer disk. The fitting procedure and fit parameters are reported in Appendix E. Times corresponding to each run are indicated in the upper-right corner. The top two panels compare the two simulations at the same absolute times (starting from the restart at t = 8580 yr), while the bottom two panels show profiles aligned to each model’s burst peak (i.e., each run’s peak Ṁ is set to t = 0), isolating the post-burst thermodynamic response.
Current usage metrics show cumulative count of Article Views (full-text article views including HTML views, PDF and ePub downloads, according to the available data) and Abstracts Views on Vision4Press platform.
Data correspond to usage on the plateform after 2015. The current usage metrics is available 48-96 hours after online publication and is updated daily on week days.
Initial download of the metrics may take a while.