Fig. 4.
Download original image
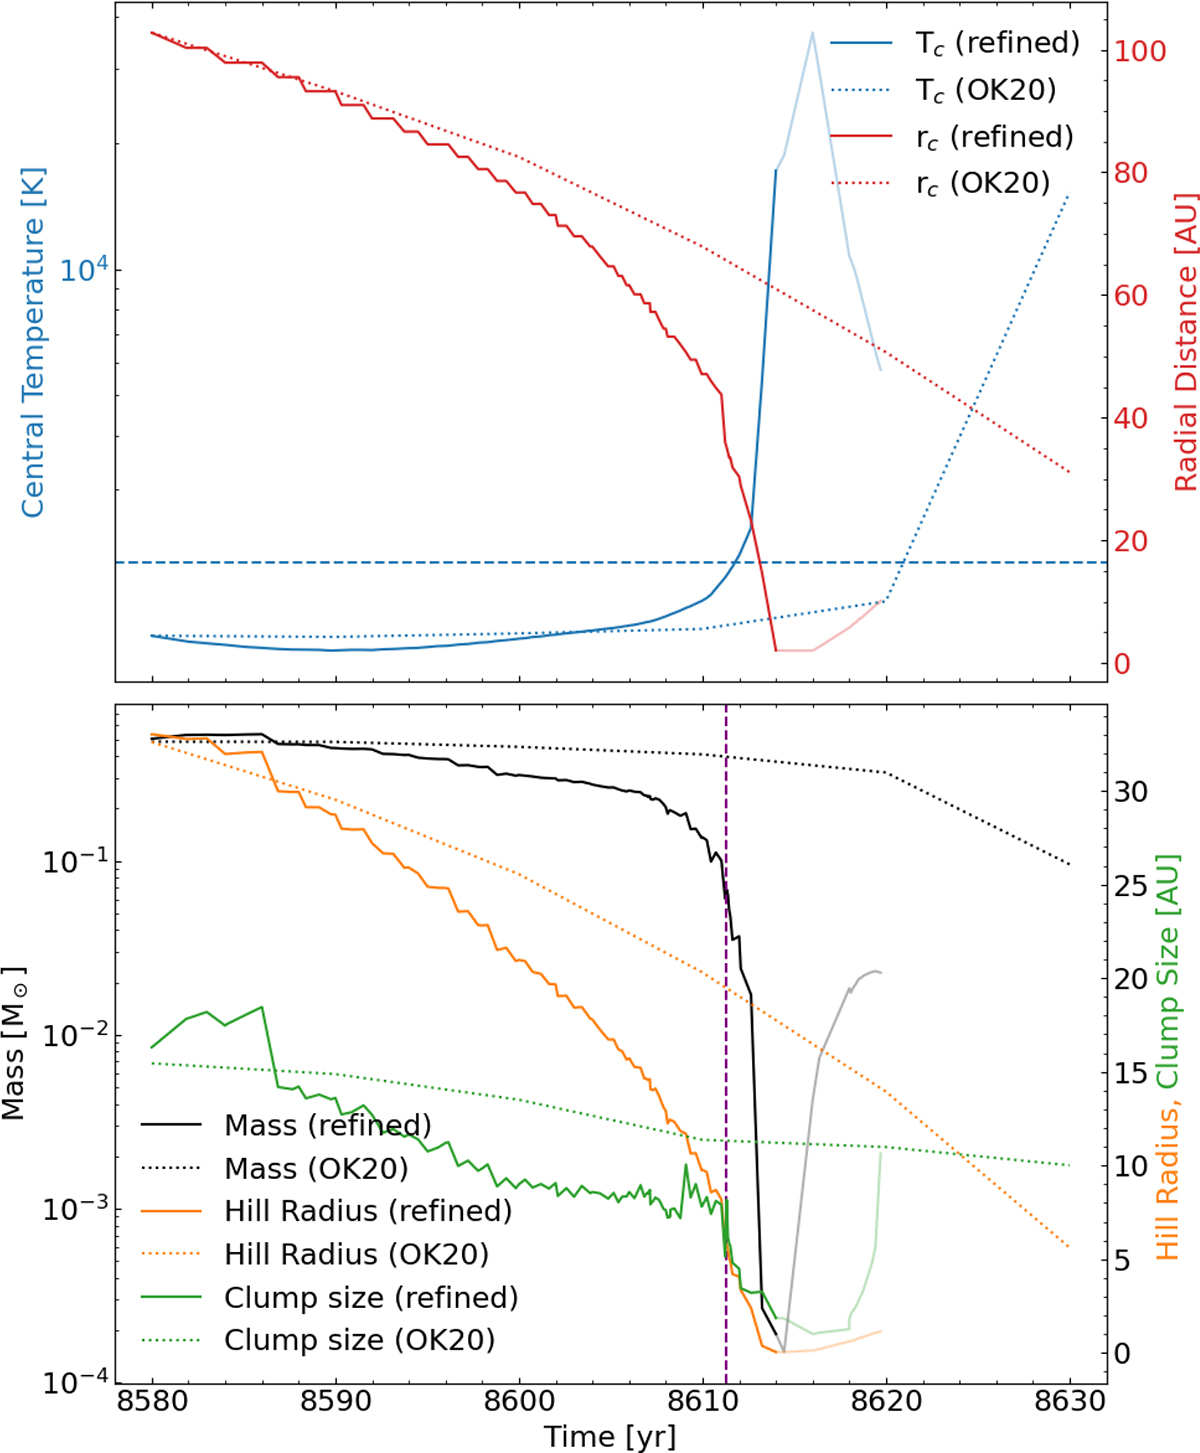
Time evolution of fragment properties for the refined (solid; semi-transparent after disruption) and OK20 (dotted) tracks. Top: Central temperature (left axis) and radial distance from the star (right axis). The horizontal dashed line marks T = 2000 K. Bottom: Fragment mass (left axis), Hill radius, and mean fragment radius (right axis). The vertical dashed line marks when the mean fragment radius equals the Hill radius.
Current usage metrics show cumulative count of Article Views (full-text article views including HTML views, PDF and ePub downloads, according to the available data) and Abstracts Views on Vision4Press platform.
Data correspond to usage on the plateform after 2015. The current usage metrics is available 48-96 hours after online publication and is updated daily on week days.
Initial download of the metrics may take a while.