Fig. 3.
Download original image
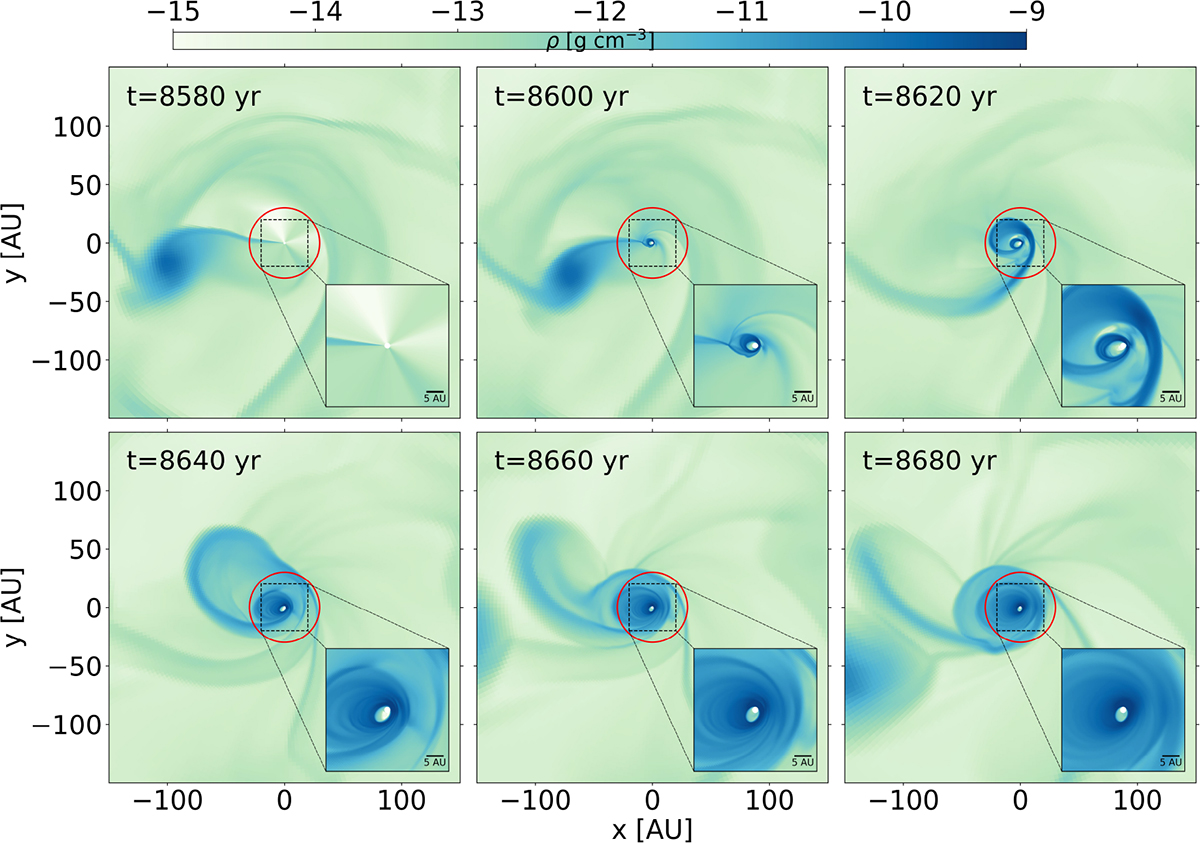
Midplane gas density during the tidal disruption of the fragment, shown at six different times. The red circle indicates the 30 AU sink cell radius used in the OK20. Insets in the lower right of each panel provide a zoomed view of the inner 40 AU × 40 AU region, with a 5 AU scale bar for reference. Dashed rectangles on the main panels denote the inset regions.
Current usage metrics show cumulative count of Article Views (full-text article views including HTML views, PDF and ePub downloads, according to the available data) and Abstracts Views on Vision4Press platform.
Data correspond to usage on the plateform after 2015. The current usage metrics is available 48-96 hours after online publication and is updated daily on week days.
Initial download of the metrics may take a while.