Fig. D.1.
Download original image
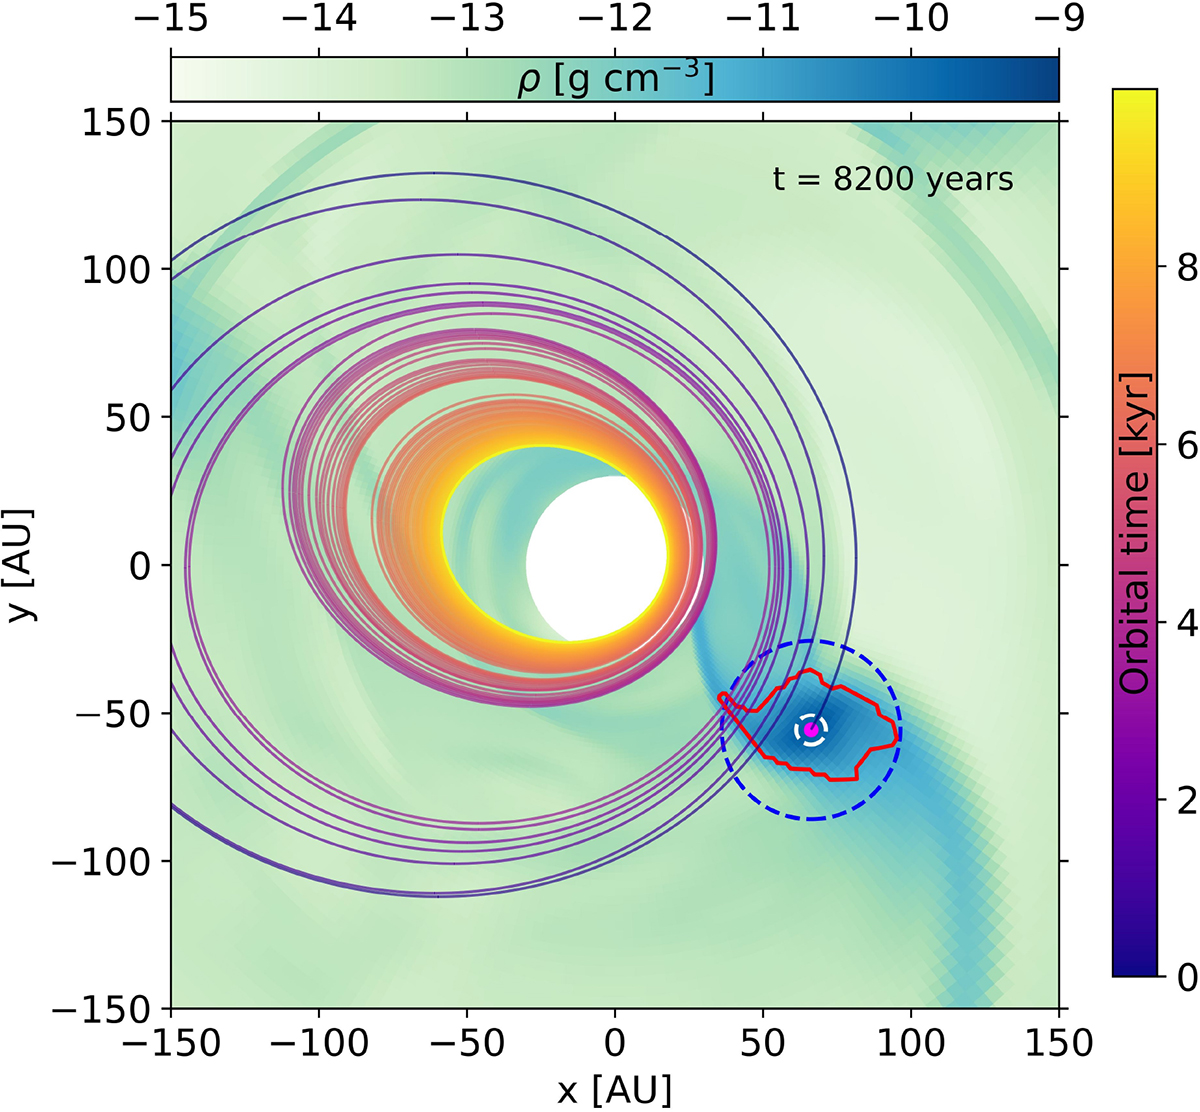
Trajectory of a gravitationally bound second Larson core (SC). The color-coded curve traces the computed orbital path over a 10-kyr integration, with color progression indicating temporal evolution. The initial velocity is determined via momentum-weighted averaging within a 5 AU sphere (white dashed line) centered on the fragment’s density maximum (magenta point). The red contour delineates the fragment boundary based on temperature-density criteria and the blue dashed circle marks the Hill radius. The background displays the midplane gas density. The highly eccentric orbit (e ≈ 0.55) and declining periastron illustrate the rapid inward migration expected for companions formed via disk fragmentation around massive stars.
Current usage metrics show cumulative count of Article Views (full-text article views including HTML views, PDF and ePub downloads, according to the available data) and Abstracts Views on Vision4Press platform.
Data correspond to usage on the plateform after 2015. The current usage metrics is available 48-96 hours after online publication and is updated daily on week days.
Initial download of the metrics may take a while.