Open Access
Fig. 9.
Download original image
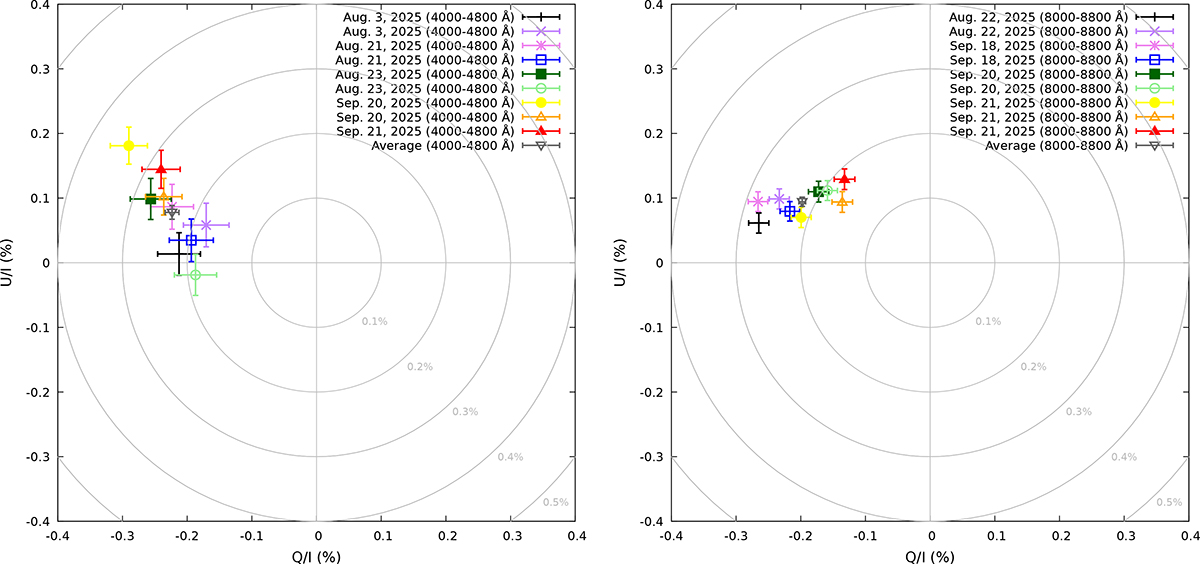
Variability in polarization for the 300V (left) and 300I (right) grisms for the nine observations of NGC 1566 taken between August and September 2025. The panels show the Q/I versus U/I diagrams, with each observation color-coded.
Current usage metrics show cumulative count of Article Views (full-text article views including HTML views, PDF and ePub downloads, according to the available data) and Abstracts Views on Vision4Press platform.
Data correspond to usage on the plateform after 2015. The current usage metrics is available 48-96 hours after online publication and is updated daily on week days.
Initial download of the metrics may take a while.