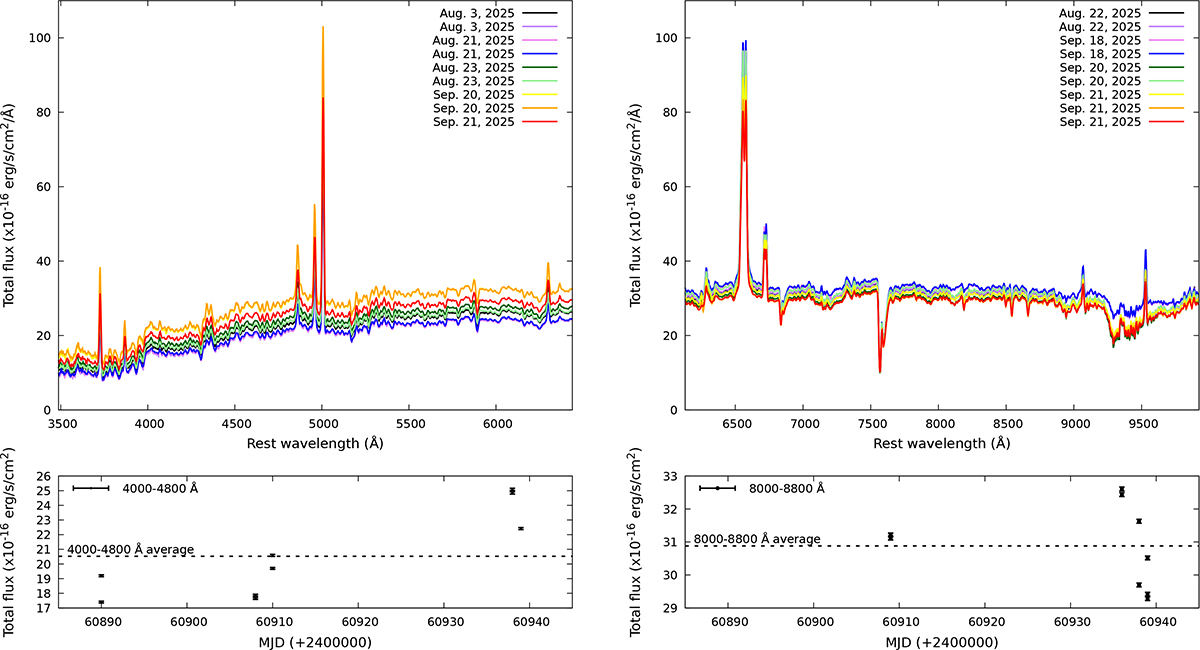
Fig. 7.
Download original image
Variability in total flux of the nine observations of NGC 1566 taken between August and September 2025, for the 300V grism (left) and the 300I grism + OG590 filter (right). Top panels: Spectra in 10−16 erg s−1 cm−2 Å−1, color-coded by observing date. Bottom panels: Evolution of the flux, integrated over different bands, as a function of the modified Julian date (MJD). The average flux is indicated with a dashed line in each bottom panel.
Current usage metrics show cumulative count of Article Views (full-text article views including HTML views, PDF and ePub downloads, according to the available data) and Abstracts Views on Vision4Press platform.
Data correspond to usage on the plateform after 2015. The current usage metrics is available 48-96 hours after online publication and is updated daily on week days.
Initial download of the metrics may take a while.