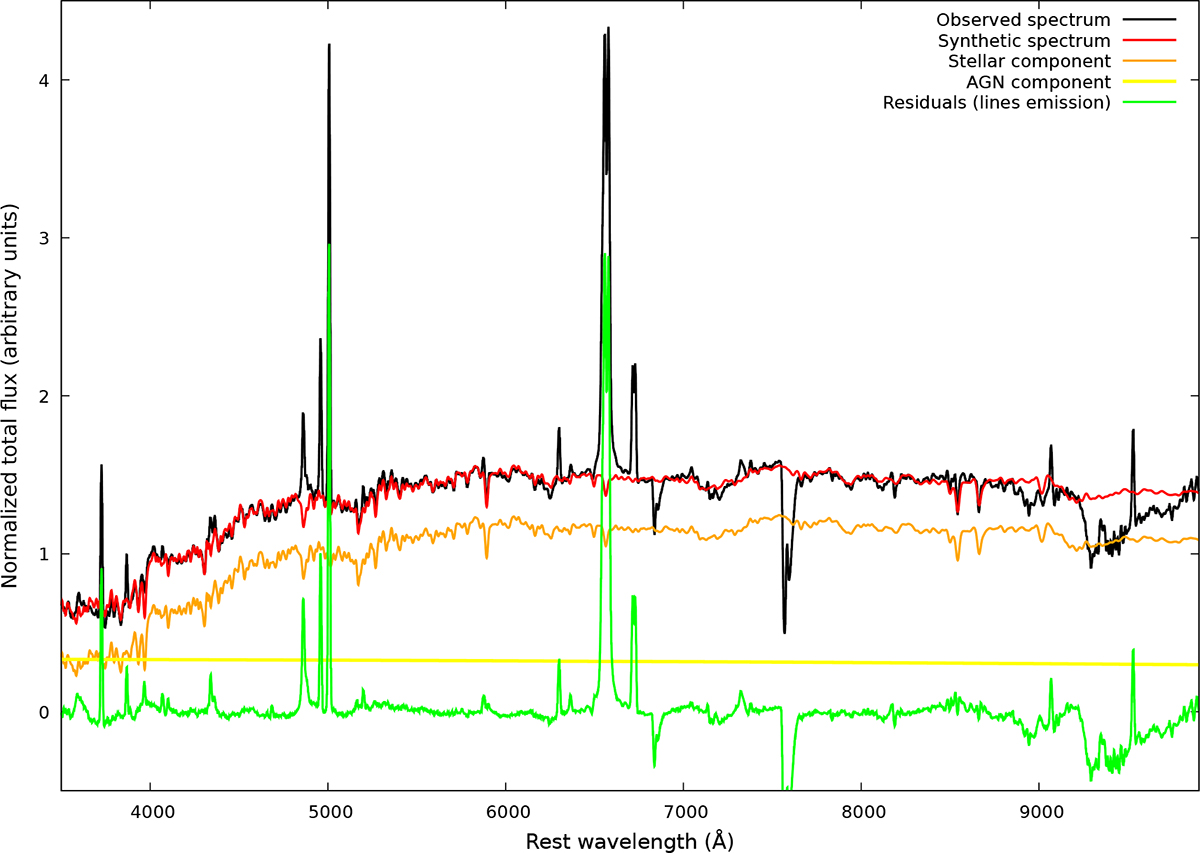
Fig. 5.
Download original image
Fits to the observed spectrum of NGC 1566 using the STARLIGHT code (Cid Fernandes et al. 2005). In black is the observed total flux spectrum (as shown in Fig. 4, top panel), in red is the synthetic spectrum obtained with the code (that is composed of the stellar component in orange and of the AGN component in yellow), and in green are the residuals. Negative fluxes in the residuals are due to the uncorrected telluric absorption lines.
Current usage metrics show cumulative count of Article Views (full-text article views including HTML views, PDF and ePub downloads, according to the available data) and Abstracts Views on Vision4Press platform.
Data correspond to usage on the plateform after 2015. The current usage metrics is available 48-96 hours after online publication and is updated daily on week days.
Initial download of the metrics may take a while.