Fig. 4.
Download original image
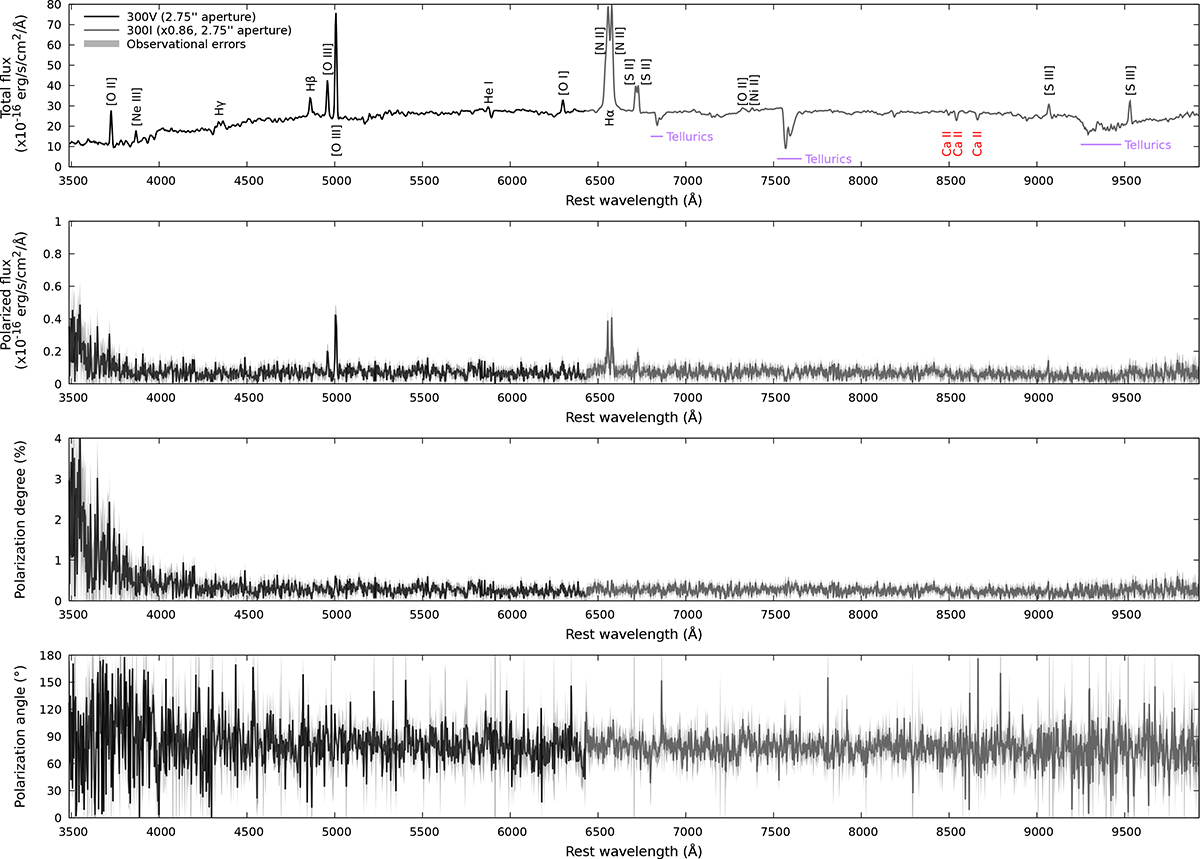
VLT/FORS2 spectropolarimetry of NGC 1566. Top panel: Total flux spectrum (in 10−16 erg s−1 cm−2 Å−1). The most prominent telluric absorption lines are indicated in purple, the calcium triplet absorption lines resulting from host starlight are indicated in red, and the most prominent emission lines are labeled in black. The 300I spectrum has been offset to match the 300V spectrum by applying a correction factor of 0.86 to account for the different observing conditions and grisms. Second panel: Polarized flux; that is, the multiplication of the total flux with the polarization degree, P. Third panel: Linear polarization degree, P. Bottom panel: Polarization position angle, θ. Spectra are shown at native spectral resolution (no binning). Observational errors are indicated in transparent gray for each spectral bin.
Current usage metrics show cumulative count of Article Views (full-text article views including HTML views, PDF and ePub downloads, according to the available data) and Abstracts Views on Vision4Press platform.
Data correspond to usage on the plateform after 2015. The current usage metrics is available 48-96 hours after online publication and is updated daily on week days.
Initial download of the metrics may take a while.