Fig. 2.
Download original image
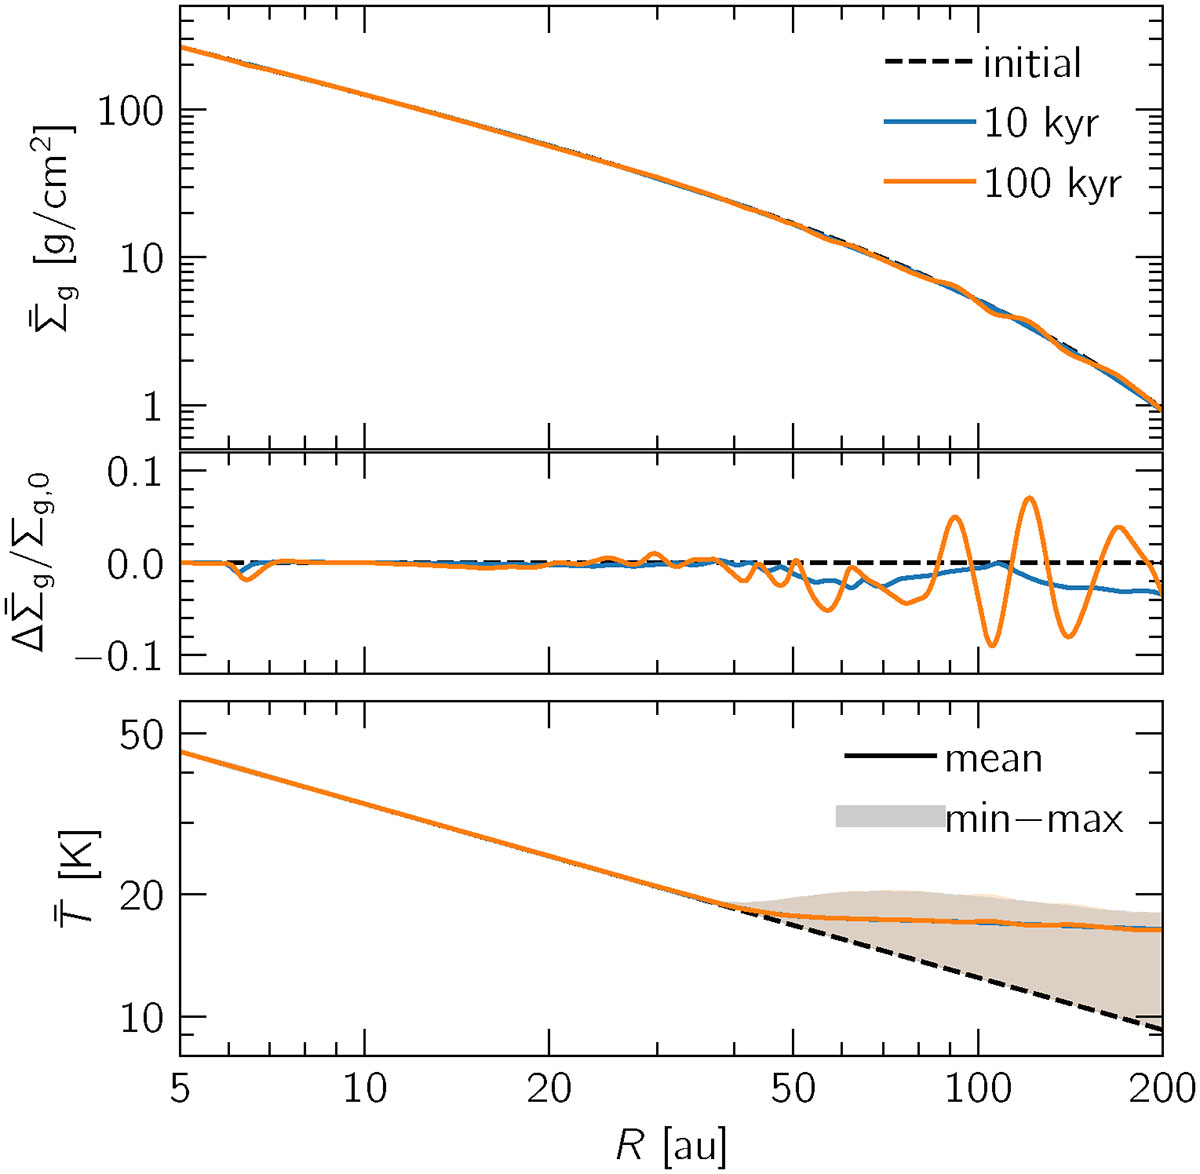
Azimuthally averaged radial profiles of the gas surface density (top) and temperature (bottom) as a function of time. Top: gas density perturbations, which, although at the few % level, grow throughout the simulation runtime due to the spirals induced by external irradiation. Bottom: the shaded region marks the temperature variation between the irradiated (upper bound) and shadowed (lower bound) sides of the disk.
Current usage metrics show cumulative count of Article Views (full-text article views including HTML views, PDF and ePub downloads, according to the available data) and Abstracts Views on Vision4Press platform.
Data correspond to usage on the plateform after 2015. The current usage metrics is available 48-96 hours after online publication and is updated daily on week days.
Initial download of the metrics may take a while.