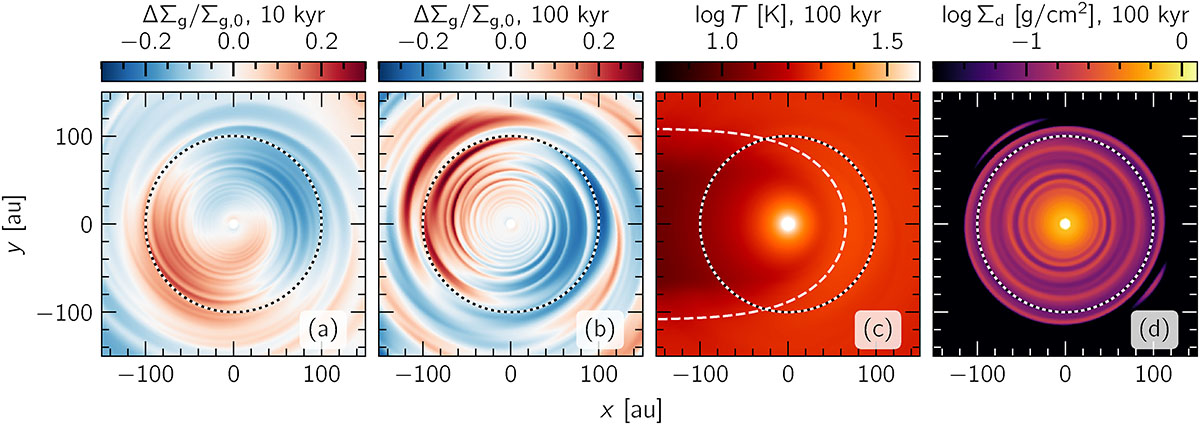
Fig. 1.
Download original image
Heatmaps of the perturbed gas density ΔΣg/Σg, 0 (panel b), temperature, T (c), and mm-grain dust density, Σd (d), after 100 kyr of evolution in our model with external irradiation, showing prominent spiral structures in gas, along with the disk’s colder, shadowed farside and rings in the dust distribution. Gas density perturbations are also shown at an earlier state (10 kyr) in panel a. A black-and-white dotted circle marks the exponential tapering radius of the disk at 100 au. The dashed line in the middle panel indicates the τ = 1 surface towards the external source (here at a distance of 0.1 pc towards the right, with a luminosity of 2 × 10⁵ L⊙), albeit computed with several underlying simplifications in Appendix A.1.
Current usage metrics show cumulative count of Article Views (full-text article views including HTML views, PDF and ePub downloads, according to the available data) and Abstracts Views on Vision4Press platform.
Data correspond to usage on the plateform after 2015. The current usage metrics is available 48-96 hours after online publication and is updated daily on week days.
Initial download of the metrics may take a while.