Fig. 5.
Download original image
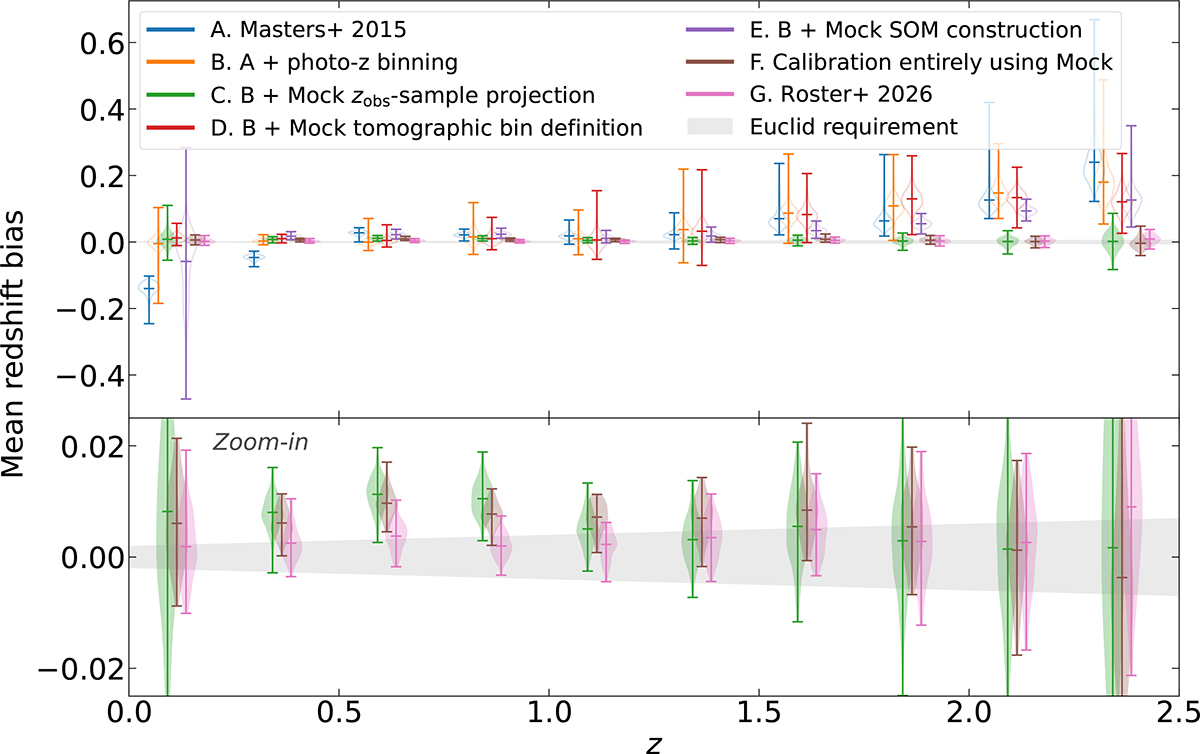
Mean redshift bias for different configurations of the calibration pipeline, shown as a function of redshift for ten equal-z tomographic bins. The bias is computed relative to the true mean redshifts of the wide-sample n(z) distributions. Violin points represent the distribution of 500 realisations, where violin points with face colour indicate calibration that used MPT-Mock-sample objects for projection and n(z) reconstruction and points with no face colour indicate the projection and reconstruction are done by using deep-sample objects. The grey shaded region indicates the Euclid requirements for n(z) accuracy in weak lensing cosmology. Blue data points represent Scenario A (original Masters et al. 2015 method); orange data points show Scenario B (photo-zs are used to define the tomographic binning); green ones Scenario C (zobs projection replaced with MPT-Mock-sample objects); red data points show Scenario D (tomographic bin defined by MPT-Mock-sample objects); purple data points are Scenario E (SOM constructed by MPT-Mock-sample objects); brown data points show Scenario F where full calibration is based on MPT-Mock sample. The pink data points correspond to Scenario G, use the per-object photo-z binning introduced in Roster et al. (2026). The data points have been slightly shifted along the x-axis for clarity.
Current usage metrics show cumulative count of Article Views (full-text article views including HTML views, PDF and ePub downloads, according to the available data) and Abstracts Views on Vision4Press platform.
Data correspond to usage on the plateform after 2015. The current usage metrics is available 48-96 hours after online publication and is updated daily on week days.
Initial download of the metrics may take a while.