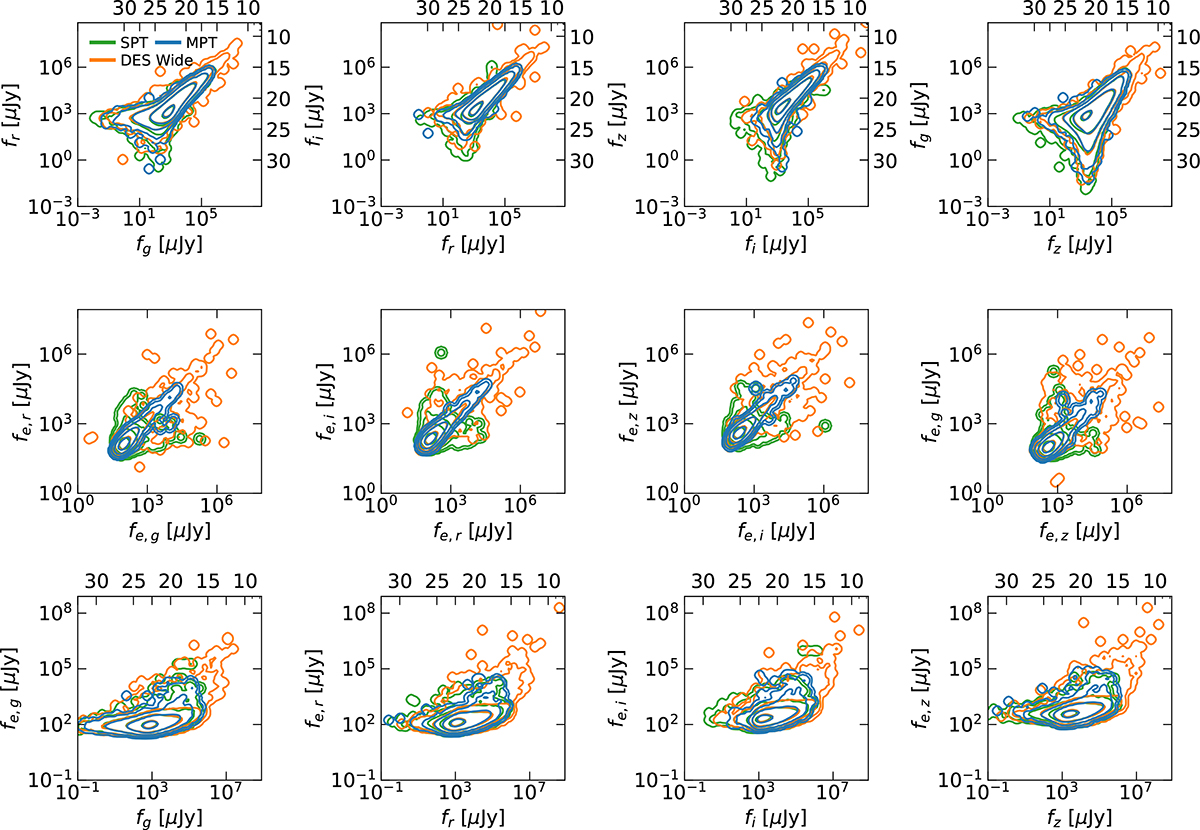
Fig. 2.
Download original image
Comparison between the DES Wide data set and our transformations in flux and colour space. The figure shows the distribution of the DES Wide data set (orange), compared with the multi-passband transfer data set introduced in this paper (blue), and the wide-like data set generated using the single-passband transfer (green), where fX and fe, X indicate flux and flux error in passband X. The number on the top or right axis of the sub-figures indicates the corresponding magnitude.
Current usage metrics show cumulative count of Article Views (full-text article views including HTML views, PDF and ePub downloads, according to the available data) and Abstracts Views on Vision4Press platform.
Data correspond to usage on the plateform after 2015. The current usage metrics is available 48-96 hours after online publication and is updated daily on week days.
Initial download of the metrics may take a while.