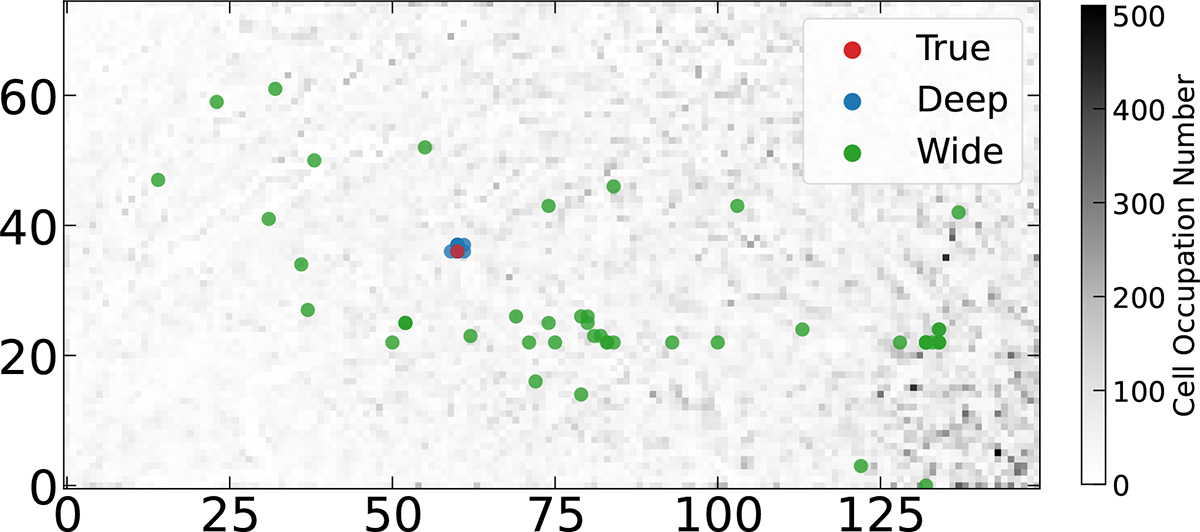
Fig. 1.
Download original image
Projection of sources onto the self-organising map (SOM) trained using 8-band photometric data (DES g, r, i, z bands and EuclidIEYE, JE, and HE bands). Each SOM cell consists of objects with similar spectral energy distributions (SEDs). The background grayscale indicates the number of objects mapped to each cell. The red dot marks the true flux of a selected object projected onto the SOM, while the blue and green markers show 50 independent realisations of the same object with Deep and Wide photometric noise, respectively.
Current usage metrics show cumulative count of Article Views (full-text article views including HTML views, PDF and ePub downloads, according to the available data) and Abstracts Views on Vision4Press platform.
Data correspond to usage on the plateform after 2015. The current usage metrics is available 48-96 hours after online publication and is updated daily on week days.
Initial download of the metrics may take a while.